Evaluation of Dispersive and Cartridge Solid Phase Extraction (SPE) Cleanups for Multiresidue Pesticides in QuEChERS Extracts of Finished Tobacco Using GCxGC-TOFMS
By Michelle Misselwitz, Jack Cochran, and Julie Kowalski
Abstract
Tobacco is a high-value production crop for the United States and ranks 6th in the amount of pesticides applied per acre in American agriculture. Even after the processing of tobacco, some pesticide residues remain on the final product. We used the Quick–Easy–Cheap–Effective–Rugged–Safe (QuEChERS) sample preparation approach to isolate residues prior to analyzing pesticides in tobacco. We evaluated the cleanup efficacy and pesticide recoveries for different formulations of QuEChERS dispersive solid phase extraction (dSPE) cleanup and the more traditional cartridge solid phase extraction (cSPE) cleanup. Comprehensive two-dimensional gas chromatography time-of-flight mass spectrometry (GCxGC-TOFMS) was used to determine pesticide residues in the resulting extracts. The results of the cleanup evaluation indicated that the dSPE cleanup formulation with 7.5 mg of carbon (verses 50 mg) provided the best recovery of targeted pesticides. The average recoveries for the 500 ppb spike level and 50 ppb spike level were 92% (13% RSD) and 91% (22% RSD) respectively.
Introduction
Tobacco has a rich history in the United States and around the world. Christopher Columbus made notes in his journal about the custom of indigenous Americans smoking a “strange leaf” and within a century tobacco was in global use. Tobacco is now grown widely, with China, India, Brazil, the United States, and Turkey producing two-thirds of the world’s supply [1].
Pesticides are used heavily on tobacco in order to increase crop production value. In fact, tobacco ranks 6th out of all crops in the U.S. in terms of pesticide application, falling only behind potatoes, tomatoes, citrus, grapes, and apples [2]. Although these fruits and vegetables are grown using more pesticides per acre, the final residue levels on these foods is regulated. No such controls exist for tobacco. Although the U.S. Environmental Protection Agency (EPA) regulates and approves the pesticides that can be applied to tobacco based on worker safety, environmental quality, and crop protection, it does not set allowable levels for pesticides in finished tobacco products. For some time, the U.S. Department of Agriculture (USDA) has analyzed pesticides in tobacco for non-EPA approved pesticides on both imported and domestic products, and recently it has also began including pesticides that are EPA-approved for application to the tobacco plant. In spite of this additional monitoring, the lack of set regulatory limits creates the potential for high levels of pesticide residues to remain on final tobacco products. A few countries that import U.S. tobacco products do have regulations on maximum residue levels of pesticides in either cigarettes or the tobacco leaf itself [2].
The QuEChERS (Quick, Easy, Cheap, Effective, Rugged, and Safe) methodology was developed for the determination of multiresidue pesticides in fruits and vegetables [3]. This methodology uses a simple shake extraction where the pesticides are extracted and partitioned using acetonitrile and a salt/buffer solution. The resultant extract is then cleaned using a very quick dispersive solid phase extraction (dSPE) step that requires no additional solvent usage. While this method was originally developed for high water content produce, we have successfully adapted the method for dry commodities, such as dietary supplements [4]. This approach utilized a modified QuEChERS extraction and a cartridge solid phase extraction cleanup (cSPE). The cSPE cleanup provides the potential for enhanced cleanup capacity for complex matrices like dietary supplements and tobacco, but it requires additional solvent and extra time for sample elution and concentration. For the more complex dietary supplement finished products we employed comprehensive two-dimensional gas chromatography time-of-flight mass spectrometry (GCxGC-TOFMS) as the determinative technique [5]. Analyzing tobacco using GCxGC proved to be a powerful technique in separating matrix interferences from the pesticides of interest.
Here we used the QuEChERS extraction approach and GCxGC-TOFMS and evaluated several cleanup methods for finished tobacco product. The tobacco extract can be very complex, so we explored both dSPE and cSPE cleanup approaches and monitored their performance for pesticide recovery and matrix reduction. The wide range of pesticides chosen for this study covered many, but not all, of the 37 pesticides that have been approved by the EPA for use on tobacco.
Experimental
Sample Preparation
Two types of bulk loose cigarette tobacco, a light and dark, were provided by Global Laboratory Services. A custom stock standard that included organochlorine, organonitrogen, and organophosphorus pesticides was prepared at Restek and diluted to 10 ng/µL and 1 ng/µL concentrations in acetonitrile. Recovery experiments were performed at two fortification levels, 500 ppb and 50 ppb. Fortified samples were prepared by adding 100 µL of the appropriate diluted standard (10 ng/µL or 1 ng/µL) to tobacco samples. Unfortified samples were also prepared in order to find potential incurred pesticides in tobacco and make matrix-matched standards for quantification.
Matrix-matched standards were prepared at 100 pg/µL and 10 pg/µL by adding 5 µL of a standard solution (1 ng/µL and 0.1 ng/µL) to 45 µL of the final cleaned extract of the unfortified tobacco samples for each type of cleanup.
QuEChERS Extraction
A 2 g sample of tobacco was weighed into a 50 mL polypropylene centrifuge tube (Restek, cat. # 26239). After the addition of 10 mL of organic-free water to the sample, 100 µL of QuEChERS internal standard mix for GC-MS analysis (Restek, cat. # 33267) was added to each sample. For samples that were fortified, 100 µL of the fortification standard was then added. Next, 10 mL of acetonitrile was added and the samples were vortexed for 30 min using a digital Vortex-Genie 2 (Scientific Industries, cat. # SI-A236). Immediately after vortexing, pre-packaged QuEChERS European EN 15662 method formulation extraction salts containing 4 g MgSO4, 1 g NaCl, 1 g trisodium citrate dihydrate, and 0.5 g disodium hydrogen citrate sesquihydrate (Restek, cat. # 25849) were added to each centrifuge tube. The tubes were immediately shaken for 1 min and then centrifuged in the Q-sep 3000 centrifuge (Restek, cat. # 28295) for 5 min at 3000 g. The top acetonitrile layer was collected and aliquots were taken for subsequent cleanup.
Extract Cleanup
Two formulations of pre-packaged dispersive solid phase extraction tubes were evaluated, the AOAC 2007.01 formulation containing 150 mg MgSO4, 50 mg primary secondary amine (PSA), 50 mg graphitized carbon black (GCB), and 50 mg C18 (Restek, cat. # 26219); and the mini-multiresidue, European EN 15662 formulation containing 150 mg MgSO4, 25 mg PSA and 7.5 mg GCB (Restek, cat.# 26218). For cleanup, a 1 mL aliquot of each extract was fortified with 5 µL of an anthracene standard (Restek, cat. # 33264) and added to the dSPE tubes. The tubes were gently shaken for 2 min and then centrifuged for 5 min using a Q-sep 3000 centrifuge (Restek, cat. # 28295). A 0.5 mL portion of the supernatant extract was removed and placed into an autosampler vial and 5 µL of a 5% formic acid solution in acetonitrile was added to each sample.
For the cartridge solid phase extraction cleanup, a 6 mL pesticide residue cleanup SPE cartridge packed with 500 mg CarboPrep 90 material and 500 mg PSA (Restek, cat. # 26194) was used. Approximately 0.5 cm of anhydrous MgSO4 was added to the top of the cartridge bed. The cartridge was rinsed with 20 mL of acetone prior to the sample being loaded. After the cartridge rinsing, 1 mL of tobacco extract was loaded onto the cartridge and eluted with 15 mL of a 3:1 acetone:toluene mixture. The eluent was collected and evaporated to 1 mL under a stream of nitrogen using a TurboVap II concentration workstation (Biotage, cat. # 103187).
GCxGC-TOFMS Analysis
A LECO Pegasus 4D GCxGC-TOFMS equipped with an Agilent 6890 GC and 7683 autoinjector was used to determine pesticide recoveries and levels of incurred pesticides in tobacco. A 30 m x 0.25 mm x 0.25 µm Rxi-5Sil MS column (Restek, cat. #13623) was installed in the primary oven and connected via a press-fit (BGB Analytik AG, cat. # 2525LD) to a 1.3 m x 0.25 mm x 0.25 µm Rtx-200 column (Restek, cat. # 15124) installed in the secondary oven. The primary oven temperature conditions were 90 °C (hold 1 min) to 310 °C (hold 2 min) at 5 °C/min. The secondary oven temperature program tracked the primary oven with a +5 °C offset. The second dimension separation time was 3 sec with a +20 °C modulator temperature offset. The carrier gas was helium operated under corrected constant flow conditions at 2 mL/min. 1 µL fast autosampler splitless injections were made with a 1 min purge valve time and an inlet temperature of 250 °C. A 4 mm Restek Premium single taper inlet liner with wool (Restek, cat. # 23303) was used for all analyses. Data were acquired from 45 to 550 u with an acquisition rate of 100 spectra/sec. The transfer line was 300 °C and electron ionization at 70 eV was used with a source temperature of 225 °C.
QuEChERS Extract Cleanup Evaluation
An Agilent 6890 GC with a flame ionization detector (FID) was used to quickly evaluate the removal of the tobacco matrix for each type of cleanup. We used a 15 m x 0.25 mm x 0.25 µm Rxi-5Sil MS column (Restek, cat. #13620) with helium carrier gas operated in constant flow at 2 mL/min. The oven temperature program was 80 °C (hold 1 min) to 350 °C (hold 5.5 min) at 20 °C/min and yielded a 20 min analysis time. A 4 mm Restek Premium single taper liner with wool was installed in the inlet, which was set to 250 °C. 1 µL fast splitless injections (0.75 min purge valve time) were performed with a 7683 autoinjector. The FID temperature was 350 °C and the makeup flow plus column flow was held constant at 50 mL/min. Data were collected at 5 Hz.
Gravimetric analyses of the nonvolatile residue remaining in the final extracts were performed for both the dSPE and cSPE cleanup procedures. Cleanups for the two formulations of dSPE tubes and the cSPE procedure were each performed in triplicate. The resultant replicate extracts were combined and added to tared conical vials that were placed on a 60 °C hotplate and evaporated under a stream of dry nitrogen gas (Thermo Scientific, Reacti-Therm I [cat.# TS-18821] and Reacti-Vap [cat. # TS-18825]). The vials were reweighed after all solvent was evaporated to determine the amount of nonvolatile material present after the extract cleanup.
All data were processed with the LECO ChromaTOF software. Recoveries of pesticides in the fortified tobacco samples were quantified using the GCxGC-TOFMS data, matrix-matched standards, and the internal standard PCB 52 for each cleanup type. The matrix-matched standards represented 100% recovery and were used for single-point calibration and quantification. Evaluation of the tobacco extract prior to cleanup and following each cleanup type were performed by overlaying the FID traces to visually inspect gross differences in cleanup efficacy.
Results and Discussion
Removal of Matrix Interferences
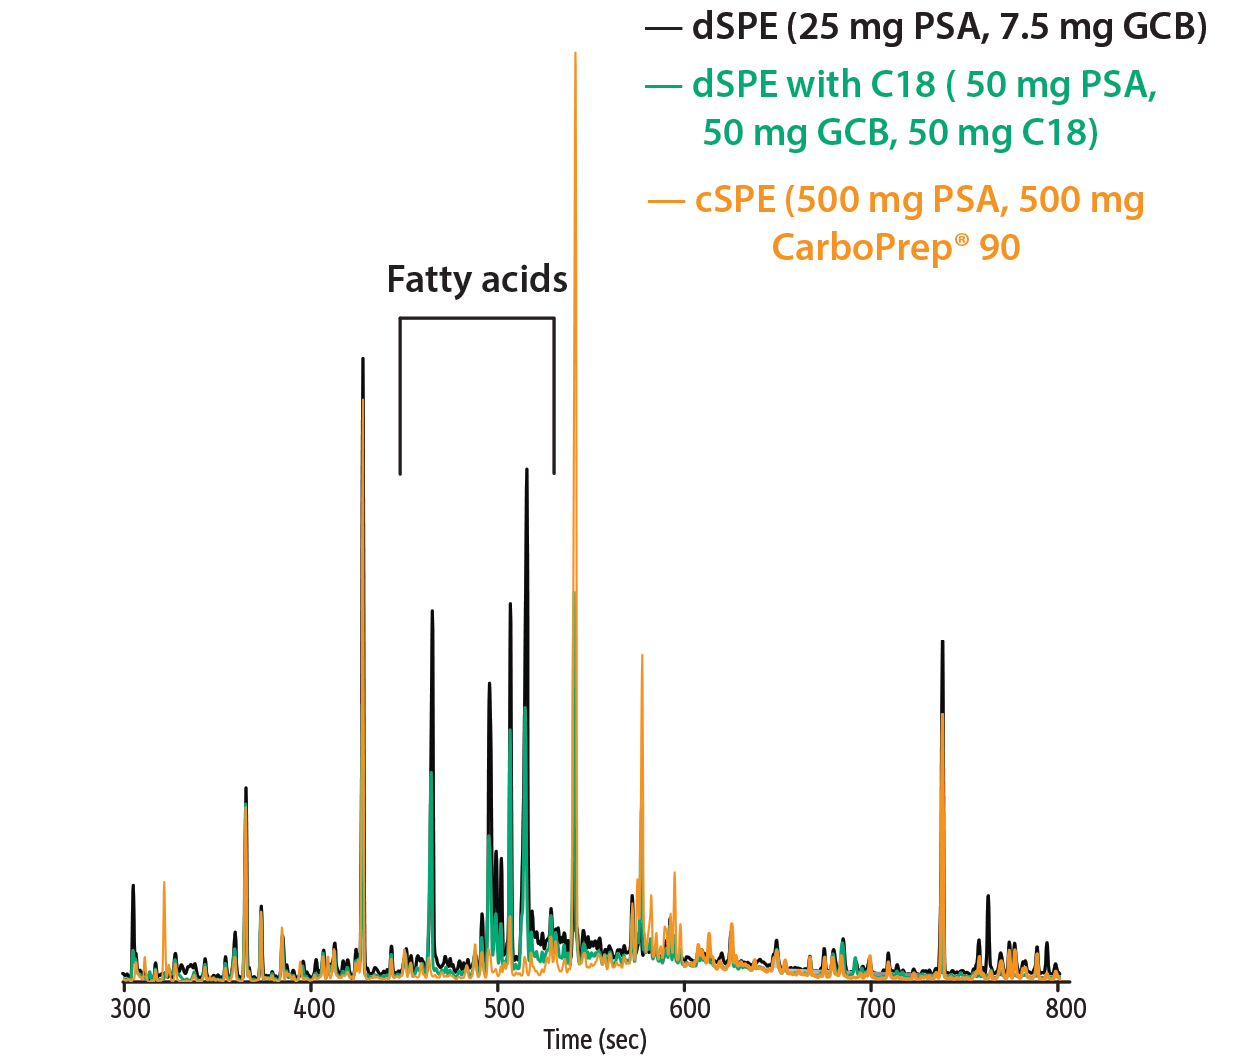
The goal of this work was to use the quicker dSPE cleanup methodology for the extracts as long as it was effective when analyzing tobacco using GCxGC-TOFMS. From previous work with complex matrices, we have found that dSPE does not have the capacity to clean the extract enough for GC-MS analysis, including GC-TOFMS or even GCxGC-TOFMS analysis [5]. In order to quickly determine if the time- and solvent-intensive cSPE was necessary, we evaluated the extracts using GC-FID. Pigment reduction from extracts is important for GC work, since many pigments are nonvolatile and quickly degrade the performance of the GC inlet and column. With a first visual inspection of the resultant extracts, it was clear that as the amount of carbon was increased, the pigment in the extract decreased (Figure 1). When overlaying the GC-FID traces for each cleanup type, it was apparent that some matrix components that were not removed by either dSPE cleanup were significantly reduced by the cSPE cleanup (Figure 2). The most notable were the fatty acids that are eluting in the middle of the chromatogram. The PSA sorbent is a weak anion exchange material and will remove fatty acids. Therefore, the 500 mg of PSA in the cSPE cartridge provided a more effective cleanup of fatty acids in the tobacco matrix than either of the dSPE cleanups, which contained just 50 mg or 25 mg of PSA. However, not all matrix interferences were further removed by the cSPE, which limits the benefits of this technique over the much quicker dSPE cleanup.
The next step in evaluating the efficacy of the different types of cleanups in removing matrix interferences was to determine the amount of nonvolatile residue that was removed by each cleanup. While nonvolatile residue will not necessarily cause interference in the actual chromatogram, it is an important aspect to evaluate when developing a cleanup method. Large amounts of residue from injected samples will quickly collect in the inlet liner and at the front of the column, degrading method performance and requiring more frequent injection port and column maintenance. In this respect, the use of wool in the splitless liner is also important in further protecting the analytical column from the residue of the tobacco matrix. The gravimetric analysis determined that the 25 mg PSA and 7.5 mg GCB dSPE formulation provided a 50% reduction in nonvolatile material from the raw tobbacco extract. The other dSPE formulation that had 50 mg PSA, 50 mg C18, 50 mg GCB removed 70% of the nonvolatile residue. The cSPE, which contained 500 mg PSA and 500 mg carbon, also removed 70% of the matrix material. The cSPE procedure took approximately 3 hours compared to just 20 minutes for the dSPE process, so the lack of additional removal of nonvolatile matrix components and only minimal improvement in cleanup of matrix intereferences did not outweigh the extra time and solvent usage of cSPE. Only the dSPE extracts were further evaluated for recovery of pesticides in tobacco on the GCxGC-TOFMS system.
Figure 1: Tobacco extract (from left to right) with no cleanup; dSPE cleanup with 7.5 mg GCB and 25 mg PSA; dSPE cleanup with 50 mg GCB, 50 mg PSA, and 50 mg C18; and cSPE cleanup with 500 mg CarboPrep 90 and 500 mg PSA.
Figure 2: GC-FID overlay of cleaned extracts evaluated for the removal of semivolatile tobacco matrix. The cSPE provided a more effective cleanup for fatty acids, but did not perform better than dSPE for all potential matrix interferences.
| Column | Rxi-5Sil MS, 15 m, 0.25 mm ID, 0.25 µm (cat.# 13620) |
|---|---|
| Standard/Sample | Tobacco extracts |
| Injection | |
| Inj. Vol.: | 1 µL splitless (hold 0.75 min) |
| Liner: | Premium 4 mm single taper w/wool (cat.# 23303) |
| Inj. Temp.: | 250 °C |
| Oven | |
| Oven Temp.: | 80 °C (hold 1 min) to 350 °C at 20 °C/min (hold 5.5 min) |
| Carrier Gas | He, constant flow |
| Flow Rate: | 2 mL/min |
| Detector | FID @ 350 °C |
|---|---|
| Constant Column + Constant Make-up: | 50 mL/min |
| Data Rate: | 5 Hz |
| Instrument | Agilent/HP6890 GC |
Pesticide Recovery
Percent recoveries for the QuEChERS extraction and dSPE cleanups were calculated for both the high (500 ppb) and low (50 ppb) fortification levels using matrix-matched standards. The use of matrix-matched standards instead of solvent-only standards ensures more accurate quantitation. Percent recoveries calculated from a solvent-only standard can have a high bias due to matrix enhancement effects that originate primarily in the GC inlet. Many of the compounds from either the EPA approved list or the USDA monitoring list were included in our study (Table I). However, some pesticides from these lists were not included because either they are not amenable to GC or because they are functionally similar to pesticides that were evaluated, so similar results should be expected.
The dSPE formulation containing 50 mg PSA, 50 mg C18, and 50 mg GCB had good average percent recoveries of 82% and 81% for the high and low fortification levels respectively, with percent relative standard deviations (% RSDs) of 23% and 33%. The other dSPE formulation containing 25 mg PSA and 7.5 mg GCB had somewhat better average recoveries of 92% and 91% (13% and 22% RSD) for the high and low fortification levels respectively (Table I ). The recovery values highlight that the QuEChERS extraction and dSPE cleanup approach that we employed for cigarette tobacco performs well for a wide range of pesticides. A closer inspection of the recovery values for individual pesticides reveals that there are several cases (e.g., pentachlorobenzene, hexachlorobenzene, pentachloroaniline, pentachlorothioanisole) where the dSPE formulation with 7.5 mg GCB clearly outperformed the formulation with 50 mg GCB. This is not surprising since we have previously reported that graphitized carbon black can reduce the recoveries of planar pesticides [6], including chlorinated fungicides such as those listed above. Unlike the cSPE cleanup, the dSPE cleanup used here does not employ any type of elution step that might help recover the planar pesticides, so the potential loss of planar pesticides increases as the amount of GCB increases.
Table I: Percent recoveries for pesticides included in the EPA approved list and USDA monitoring list for tobacco determined using QuEChERS extraction, dSPE cleanup, and GCxGC-TOFMS analysis.
| 500 ppb Fortified Sample (100 pg on-column) |
50 ppb Fortified Sample (10 pg on-column) |
|||||
| Pesticide | Regulatory List* |
50 mg PSA, 50 mg C18, 50 mg GCB |
25 mg PSA, 7.5 mg GCB |
50 mg PSA, 50 mg C18, 50 mg GCB |
25 mg PSA, 7.5 mg GCB |
|
| Methamidophos | USDA | 77 | 83 | 72 | 89 | |
| Dichlorvos | 95 | 101 | 74 | 109 | ||
| 1,2,3,5-Tetrachlorobenzene | 70 | 82 | 68 | 85 | ||
| Mevinphos | USDA | 89 | 101 | 103 | 112 | |
| Acephate | EPA/USDA | 93 | 87 | 69 | 105 | |
| Pentachlorobenzene | 49 | 75 | 45 | 76 | ||
| o-Phenylphenol | 94 | 100 | 91 | 96 | ||
| Tetrachloronitrobenzene | 74 | 93 | 90 | 93 | ||
| Omethoate | USDA | 97 | 91 | 76 | 96 | |
| 2,3,5,6-Tetrachloroaniline | 75 | 92 | 64 | 92 | ||
| alpha-BHC | 92 | 94 | 90 | 99 | ||
| Hexachlorobenzene | USDA | 21 | 61 | 18 | 63 | |
| Pentachloroanisole | 59 | 80 | 58 | 84 | ||
| Dimethoate | USDA | 100 | 102 | 85 | 91 | |
| beta-BHC | 96 | 94 | 82 | 92 | ||
| Pentachloronitrobenzene | 61 | 85 | 56 | 73 | ||
| Pentachlorobenzonitrile | 46 | 90 | 40 | 84 | ||
| gamma-BHC | 94 | 95 | 86 | 94 | ||
| Chlorothalonil | 59 | 80 | 53 | 77 | ||
| Anthracene | 96 | 107 | 103 | 106 | ||
| Diazinon | EPA/USDA | 88 | 96 | 98 | 77 | |
| delta-BHC | 95 | 94 | 97 | 103 | ||
| Pentachloroaniline | 43 | 82 | 41 | 84 | ||
| Vinclozolin | 95 | 97 | 110 | 83 | ||
| Carbaryl | EPA | 94 | 95 | 79 | 100 | |
| Metalaxyl | EPA/USDA | 100 | 98 | 166 | 78 | |
| Pentachlorothioanisole | 21 | 67 | 30 | 70 | ||
| Pirimiphos methyl | 93 | 93 | 78 | 85 | ||
| Methiocarb | 93 | 95 | 85 | 92 | ||
| Dichlofluanid | 86 | 90 | 77 | 88 | ||
| Malathion | EPA | 98 | 94 | 93 | 132 | |
| Chlorpyrifos | EPA/USDA | 83 | 91 | 77 | 83 | |
| Fenthion | USDA | 93 | 88 | 78 | 97 | |
| DCPA | 94 | 97 | 76 | 85 | ||
| Parathion | USDA | 89 | 100 | 112 | 98 | |
| Cyprodinil | 51 | 92 | 73 | 127 | ||
| Heptachlor epoxide | USDA | 87 | 91 | 91 | 88 | |
| Thiabendazole | 50 | 94 | 51 | 150 | ||
| Captan | USDA | 91 | 77 | ND | ND | |
| Folpet | 84 | 90 | 67 | 66 | ||
| Procymidone | 94 | 95 | 83 | 99 | ||
| Endosulfan I | EPA/USDA | 75 | 87 | 61 | 100 | |
| Imazalil | 108 | 101 | ND | ND | ||
| 4,4'-DDE | USDA | 67 | 76 | 58 | 71 | |
| Dieldrin | USDA | 75 | 83 | 76 | 101 | |
| Myclobutanil | 96 | 98 | 112 | 94 | ||
| Endrin | USDA | 75 | 87 | 87 | 106 | |
| Endosulfan II | EPA/USDA | 92 | 93 | 101 | 91 | |
| Oxadixyl | 97 | 91 | 83 | 172 | ||
| 4,4'-DDD | USDA | 80 | 100 | 83 | 74 | |
| 2,4'-DDT | USDA | 71 | 76 | 66 | 78 | |
| Carfentrazone ethyl | 99 | 122 | 117 | 114 | ||
| Endosulfan sulfate | EPA/USDA | 94 | 97 | 74 | 94 | |
| Fenhexamid | 123 | 103 | 81 | 111 | ||
| 4,4'-DDT | USDA | 76 | 79 | 72 | 74 | |
| Propargite | 88 | 100 | 107 | 57 | ||
| Piperonyl butoxide | 86 | 99 | 99 | 86 | ||
| Iprodione | 96 | 105 | 81 | 88 | ||
| Bifenthrin | 73 | 72 | 68 | 75 | ||
| Dicofol | 75 | 57 | ND | 50 | ||
| Fenpropathrin | 82 | 98 | 107 | 75 | ||
| Phosalone | 83 | 95 | 78 | 79 | ||
| Azinphos methyl | 99 | 94 | ND | ND | ||
| cis-Permethrin | USDA | 70 | 84 | 66 | 71 | |
| Coumaphos | 59 | 88 | 46 | 132 | ||
| trans-Permethrin | USDA | 85 | 90 | 74 | 74 | |
| Cypermethrin | USDA | 85 | 105 | ND | ND | |
| Pyraclostrobin | 75 | 95 | 66 | 62 | ||
| Fluvalinate | 84 | 97 | 143 | 94 | ||
| Difenoconazole | 88 | 89 | 110 | 104 | ||
| Deltamethrin | 79 | 84 | 53 | 63 | ||
| Azoxystrobin | 102 | 104 | 73 | 99 | ||
| * EPA approved list and USDA monitoring list | ||||||
GCxGC-TOFMS Analysis
The fortification levels of the pesticides in the cigarette tobacco samples were equivalent to 100 pg and 10 pg on-column, assuming 100% recoveries were achieved with QuEChERS and the chosen cleanup. These detection levels would not be possible with full-scan GC-MS analysis with a quadrupole. A TOFMS has pg-level detectability for many pesticides and, by utilizing comprehensive two-dimensional GC, we are able to further decrease the detection limits due to the peak focusing of the modulator. The peaks eluting from the first dimension column are trapped and then immediately injected onto the very short and fast second dimension column. This yields peaks that are 100 ms wide, increasing the signal-to-noise ratio (S/N) and detectability. Only four of the targeted pesticides were not detected in the 50 ppb fortified tobacco sample using GCxGC-TOFMS.
The QuEChERS method utilizes dSPE because it provides a fast way to clean up extracts, while removing “just enough” of the matrix intereferences to accurately quantify pesticides of interest. For the most part, laboratories are performing targeted pesticide analysis and, therefore, using GC-MS operated in the selected ion monitoring (SIM) mode. While GC-MS (SIM) is somewhat selective, matrix components can still negatively impact quantification. Gross overload of matrix intereferences can shift peaks of interest, so the retention times do not match standards and can even shift them far enough that the SIM window no longer detects the analyte. Isobaric intereferences of matrix components can also impact data quality of target pesticides by skewing the ion ratios used for both qualification and quantification. This is especially problematic for analyzing pesticides in tobacco that do not have intense higher m/z ions that can be used for quantification and qualification ion ratios. The use of GC-MS (SIM) can require a more comprehensive cleanup, like cSPE, in order to avoid these issues.
By using GCxGC-TOFMS, matrix interferences can be chromatographically separated from the pesticides of interest. This can help alleviate some of the quantification issues with extracts that have not gone through a more extensive cleanup. By coupling the GCxGC to the time-of-flight mass spectrometer we have the sensitivity of a GC-MS (SIM) analysis and the added ability to perform non-target screening of pesticide residues. With all of the spectral information collected, the data can be archived and re-examined in the future for historical information on pesticides that were not targeted or not expected to be in the extracts.
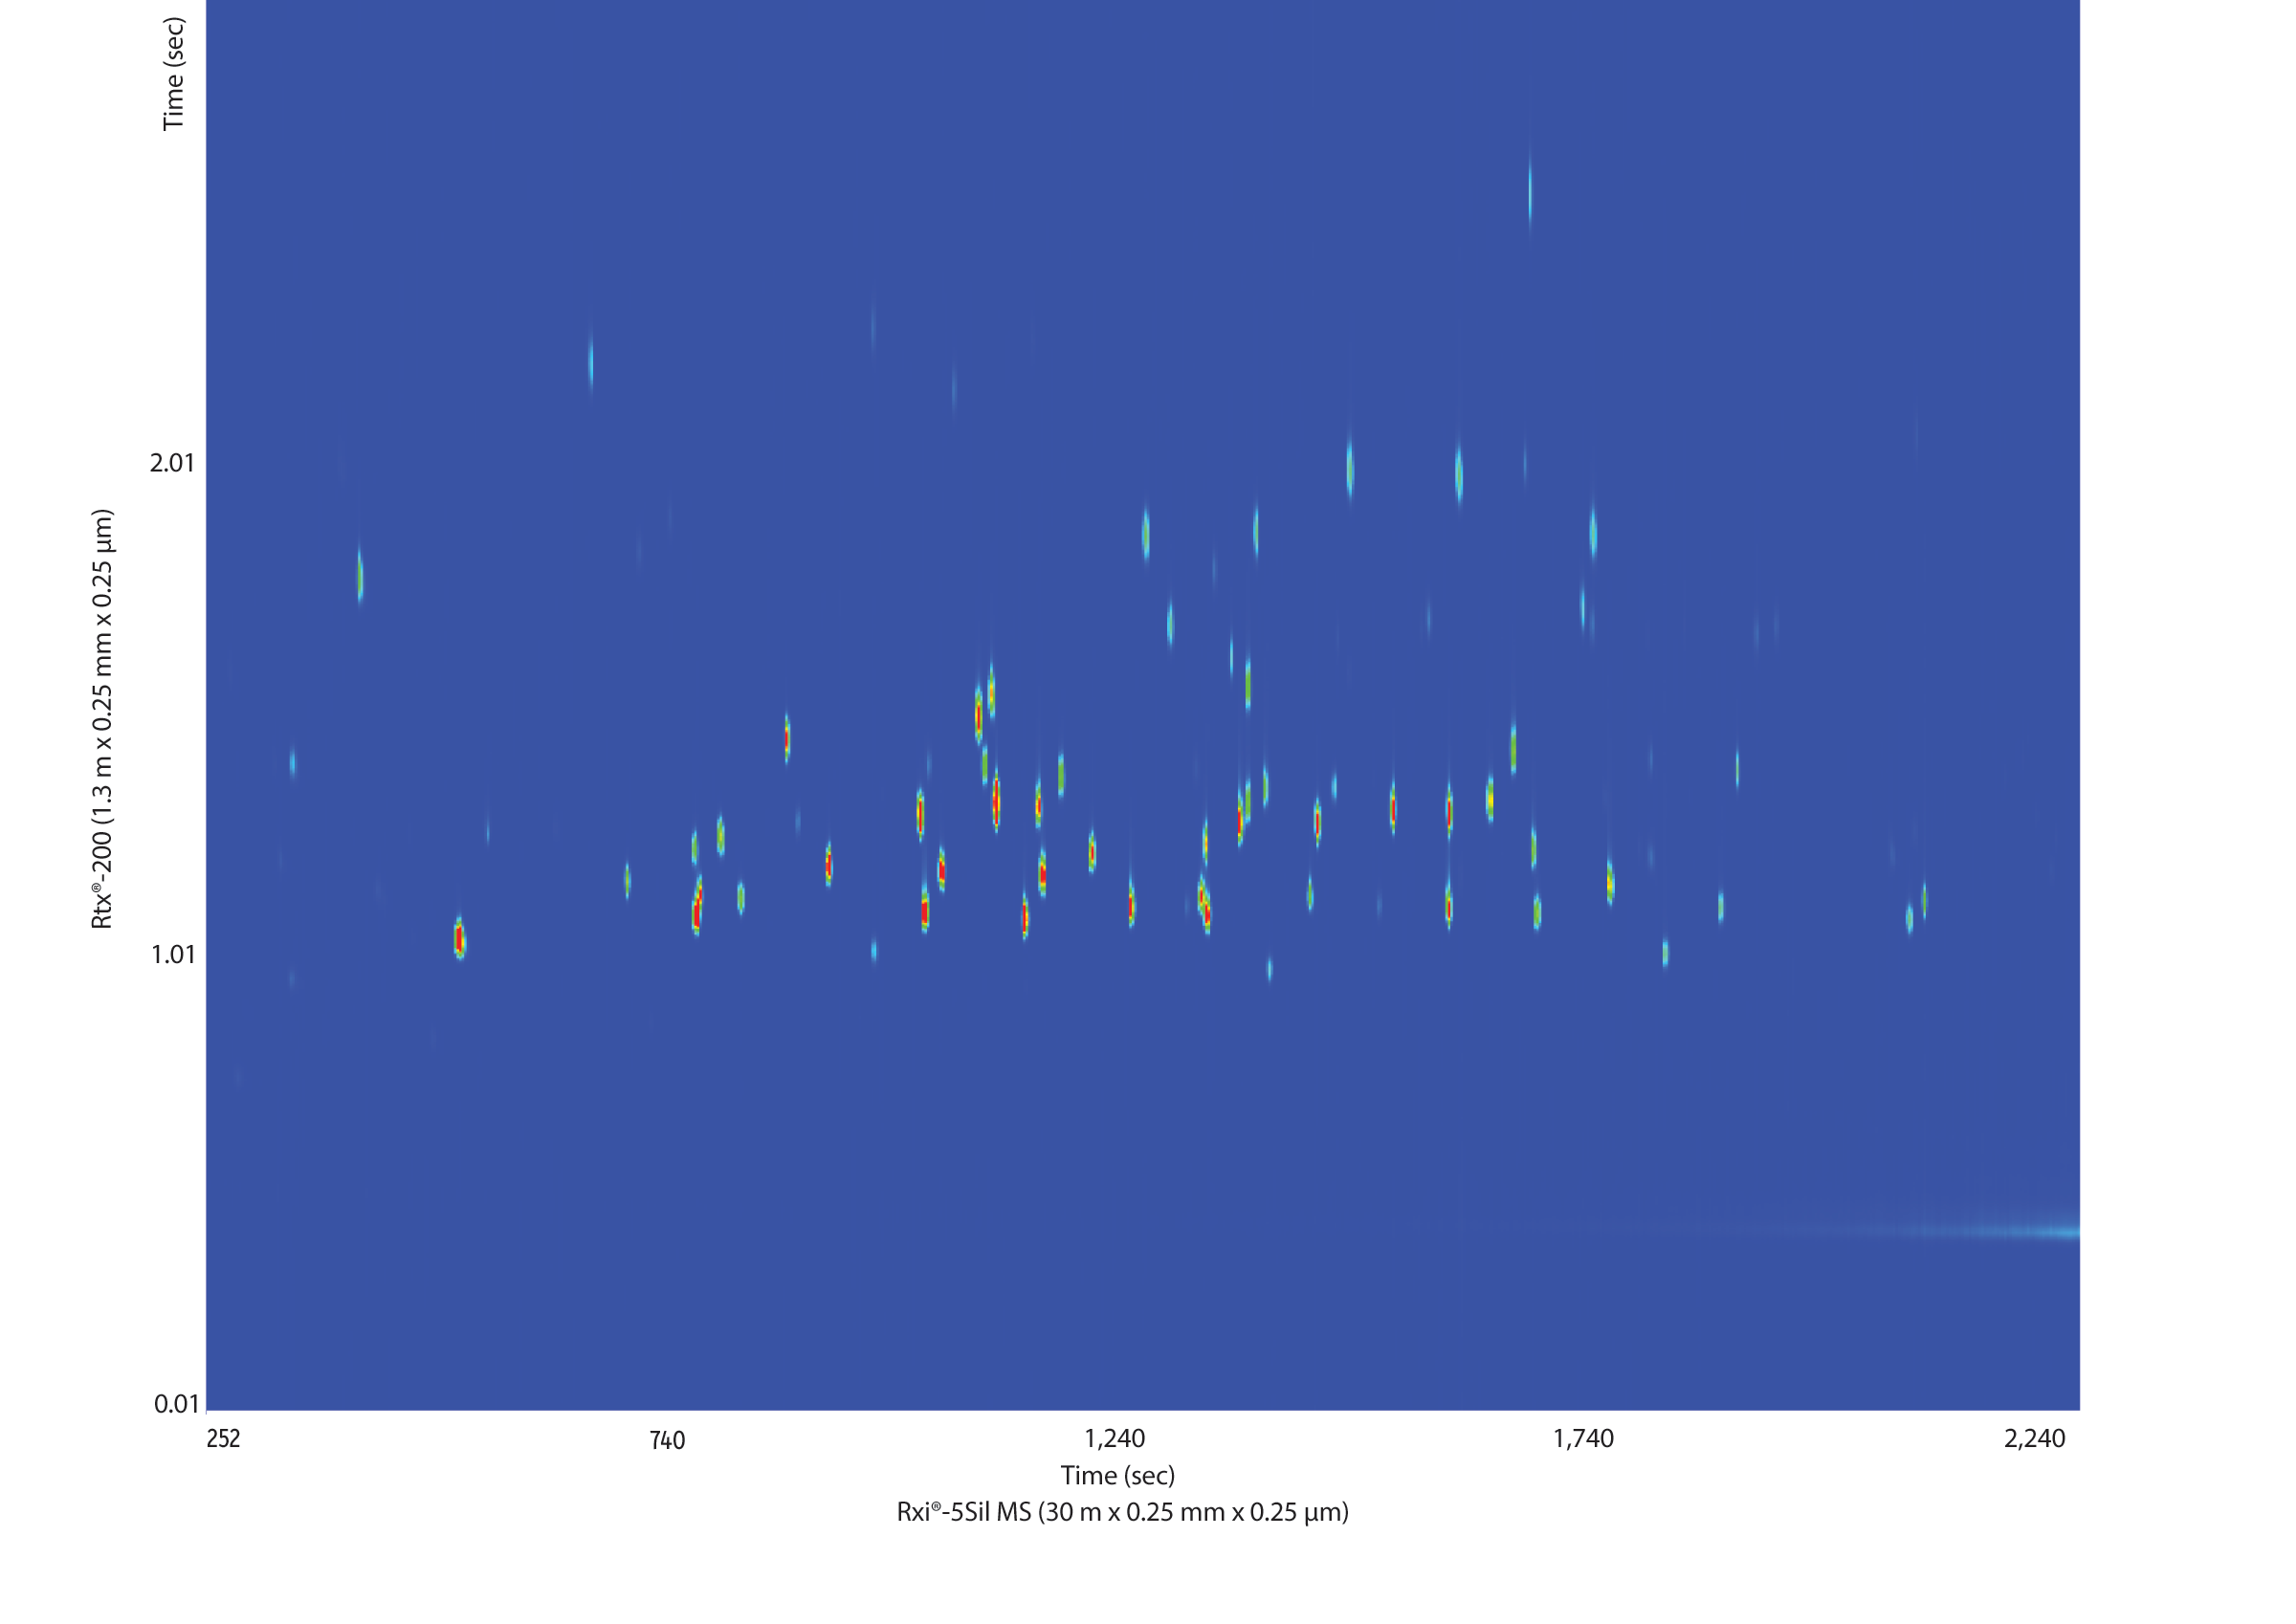
In order to maximize the GCxGC separation space we chose two columns of different selectivities, a nonpolar Rxi-5Sil MS column for the first dimension and a more polar selective Rtx-200 column for the second dimension. The chemically diverse group of pesticides was nicely spread across the contour plot by using this column configuration (Figure 3).
Figure 3: The Rxi-5Sil MS and Rtx-200 columns have orthogonal selectivities that provide a good separation of a multi-pesticide standard.
| Peaks | |
|---|---|
| 1. | Methamidophos |
| 2. | Dichlorvos |
| 3. | 1,2,3,5-Tetrachlorobenzene |
| 4. | Mevinphos |
| 5. | Acephate |
| 6. | Pentachlorobenzene |
| 7. | o-Phenylphenol |
| 8. | Tetrachloronitrobenzene (Tecnazene) |
| 9. | Omethoate |
| 10. | 2,3,5,6-Tetrachloroaniline |
| 11. | Alpha-BHC |
| 12. | Hexachlorobenzene |
| 13. | Pentachloroanisole |
| 14. | Dimethoate |
| 15. | Beta-BHC |
| 16. | Pentachloronitrobenzene |
| 17. | Pentachlorobenzonitrile |
| 18. | Gamma-BHC |
| 19. | Chlorothalonil |
| 20. | Anthracene |
| 21. | Diazinon |
| 22. | delta-BHC |
| 23. | Pentachloroaniline |
| 24. | Vinclozolin |
| Peaks | |
|---|---|
| 25. | Carbaryl |
| 26. | Metalaxyl |
| 27. | Pentachlorothioanisole |
| 28. | Pirimiphos methyl |
| 29. | Methiocarb |
| 30. | Dichlofluanid |
| 31. | Malathion |
| 32. | Chlorpyrifos |
| 33. | Fenthion |
| 34. | DCPA methyl ester (Chlorthal-dimethyl) |
| 35. | Parathion |
| 36. | Cyprodinil |
| 37. | Heptachlor epoxide |
| 38. | Thiabendazole |
| 39. | Captan |
| 40. | Folpet |
| 41. | Procymidone |
| 42. | Endosulfan I |
| 43. | Imazalil |
| 44. | 4,4'-DDE |
| 45. | Dieldrin |
| 46. | Myclobutanil |
| 47. | Endrin |
| 48. | Endosulfan II |
| Peaks | |
|---|---|
| 49. | Oxadixyl |
| 50. | 4,4'-DDD |
| 51. | 2,4'-DDT |
| 52. | Carfentrazone ethyl |
| 53. | Endosulfan sulfate |
| 54. | Fenhexamid |
| 55. | 4,4'-DDT |
| 56. | Propargite |
| 57. | Piperonyl butoxide |
| 58. | Iprodione |
| 59. | Bifenthrin |
| 60. | Dicofol |
| 61. | Fenpropathrin |
| 62. | Phosalone |
| 63. | Azinphos-methyl |
| 64. | cis-Permethrin |
| 65. | Coumaphos |
| 66. | trans-permethrin |
| 67. | Cypermethrin |
| 68. | Pyraclostrobin |
| 69. | Fluvalinate |
| 70. | Difenoconazole |
| 71. | Deltamethrin |
| 72. | Azoxystrobin |
| Column | Rxi-5Sil MS 30 m, 0.25 mm ID, 0.25 µm (cat.# 13623) |
|---|---|
| Rtx-200 1.3 m, 0.25 mm ID, 0.25 µm (cat.# 15124) | |
| Standard/Sample | Custom pesticide standard |
| Diluent: | Acetonitrile |
| Conc.: | 500 pg/µL |
| Injection | |
| Inj. Vol.: | 1.0 µL splitless (hold 1.0 min) |
| Liner: | Premium 4 mm single taper w/wool (cat.# 23303) |
| Inj. Temp.: | 250 °C |
| Oven | |
| Oven Temp.: | Rxi-5Sil MS: 90 °C (hold 1.0 min) to 310 °C at 5 °C/min (hold 2.0 min) Rtx-200: 95 °C (hold 1.0 min) to 315 °C at 5 °C/min (hold 2.0 min) |
| Carrier Gas | He, corrected constant flow (2 mL/min) |
| Modulation | |
| Modulator Temp. Offset: | +20 °C |
| Second Dimension Separation Time: | 3 sec |
| Hot Pulse Time: | 0.9 sec |
| Cool Time between Stages: | 0.6 sec |
| Detector | MS |
|---|---|
| Mode: | |
| Transfer Line Temp.: | 300 °C |
| Analyzer Type: | TOF |
| Source Temp.: | 225 °C |
| Electron Energy: | 70 eV |
| Mass Defect: | -20 mu/100 u |
| Ionization Mode: | EI |
| Acquisition Range: | 45 to 550 amu |
| Spectral Acquisition Rate: | 100 spectra/sec |
| Instrument | LECO Pegasus 4D GCxGC-TOFMS |
| Notes | Rtx-200 (cat.# 15124) is a 2 m column. A 1.3 m section was cut off and used as the second dimension column. |
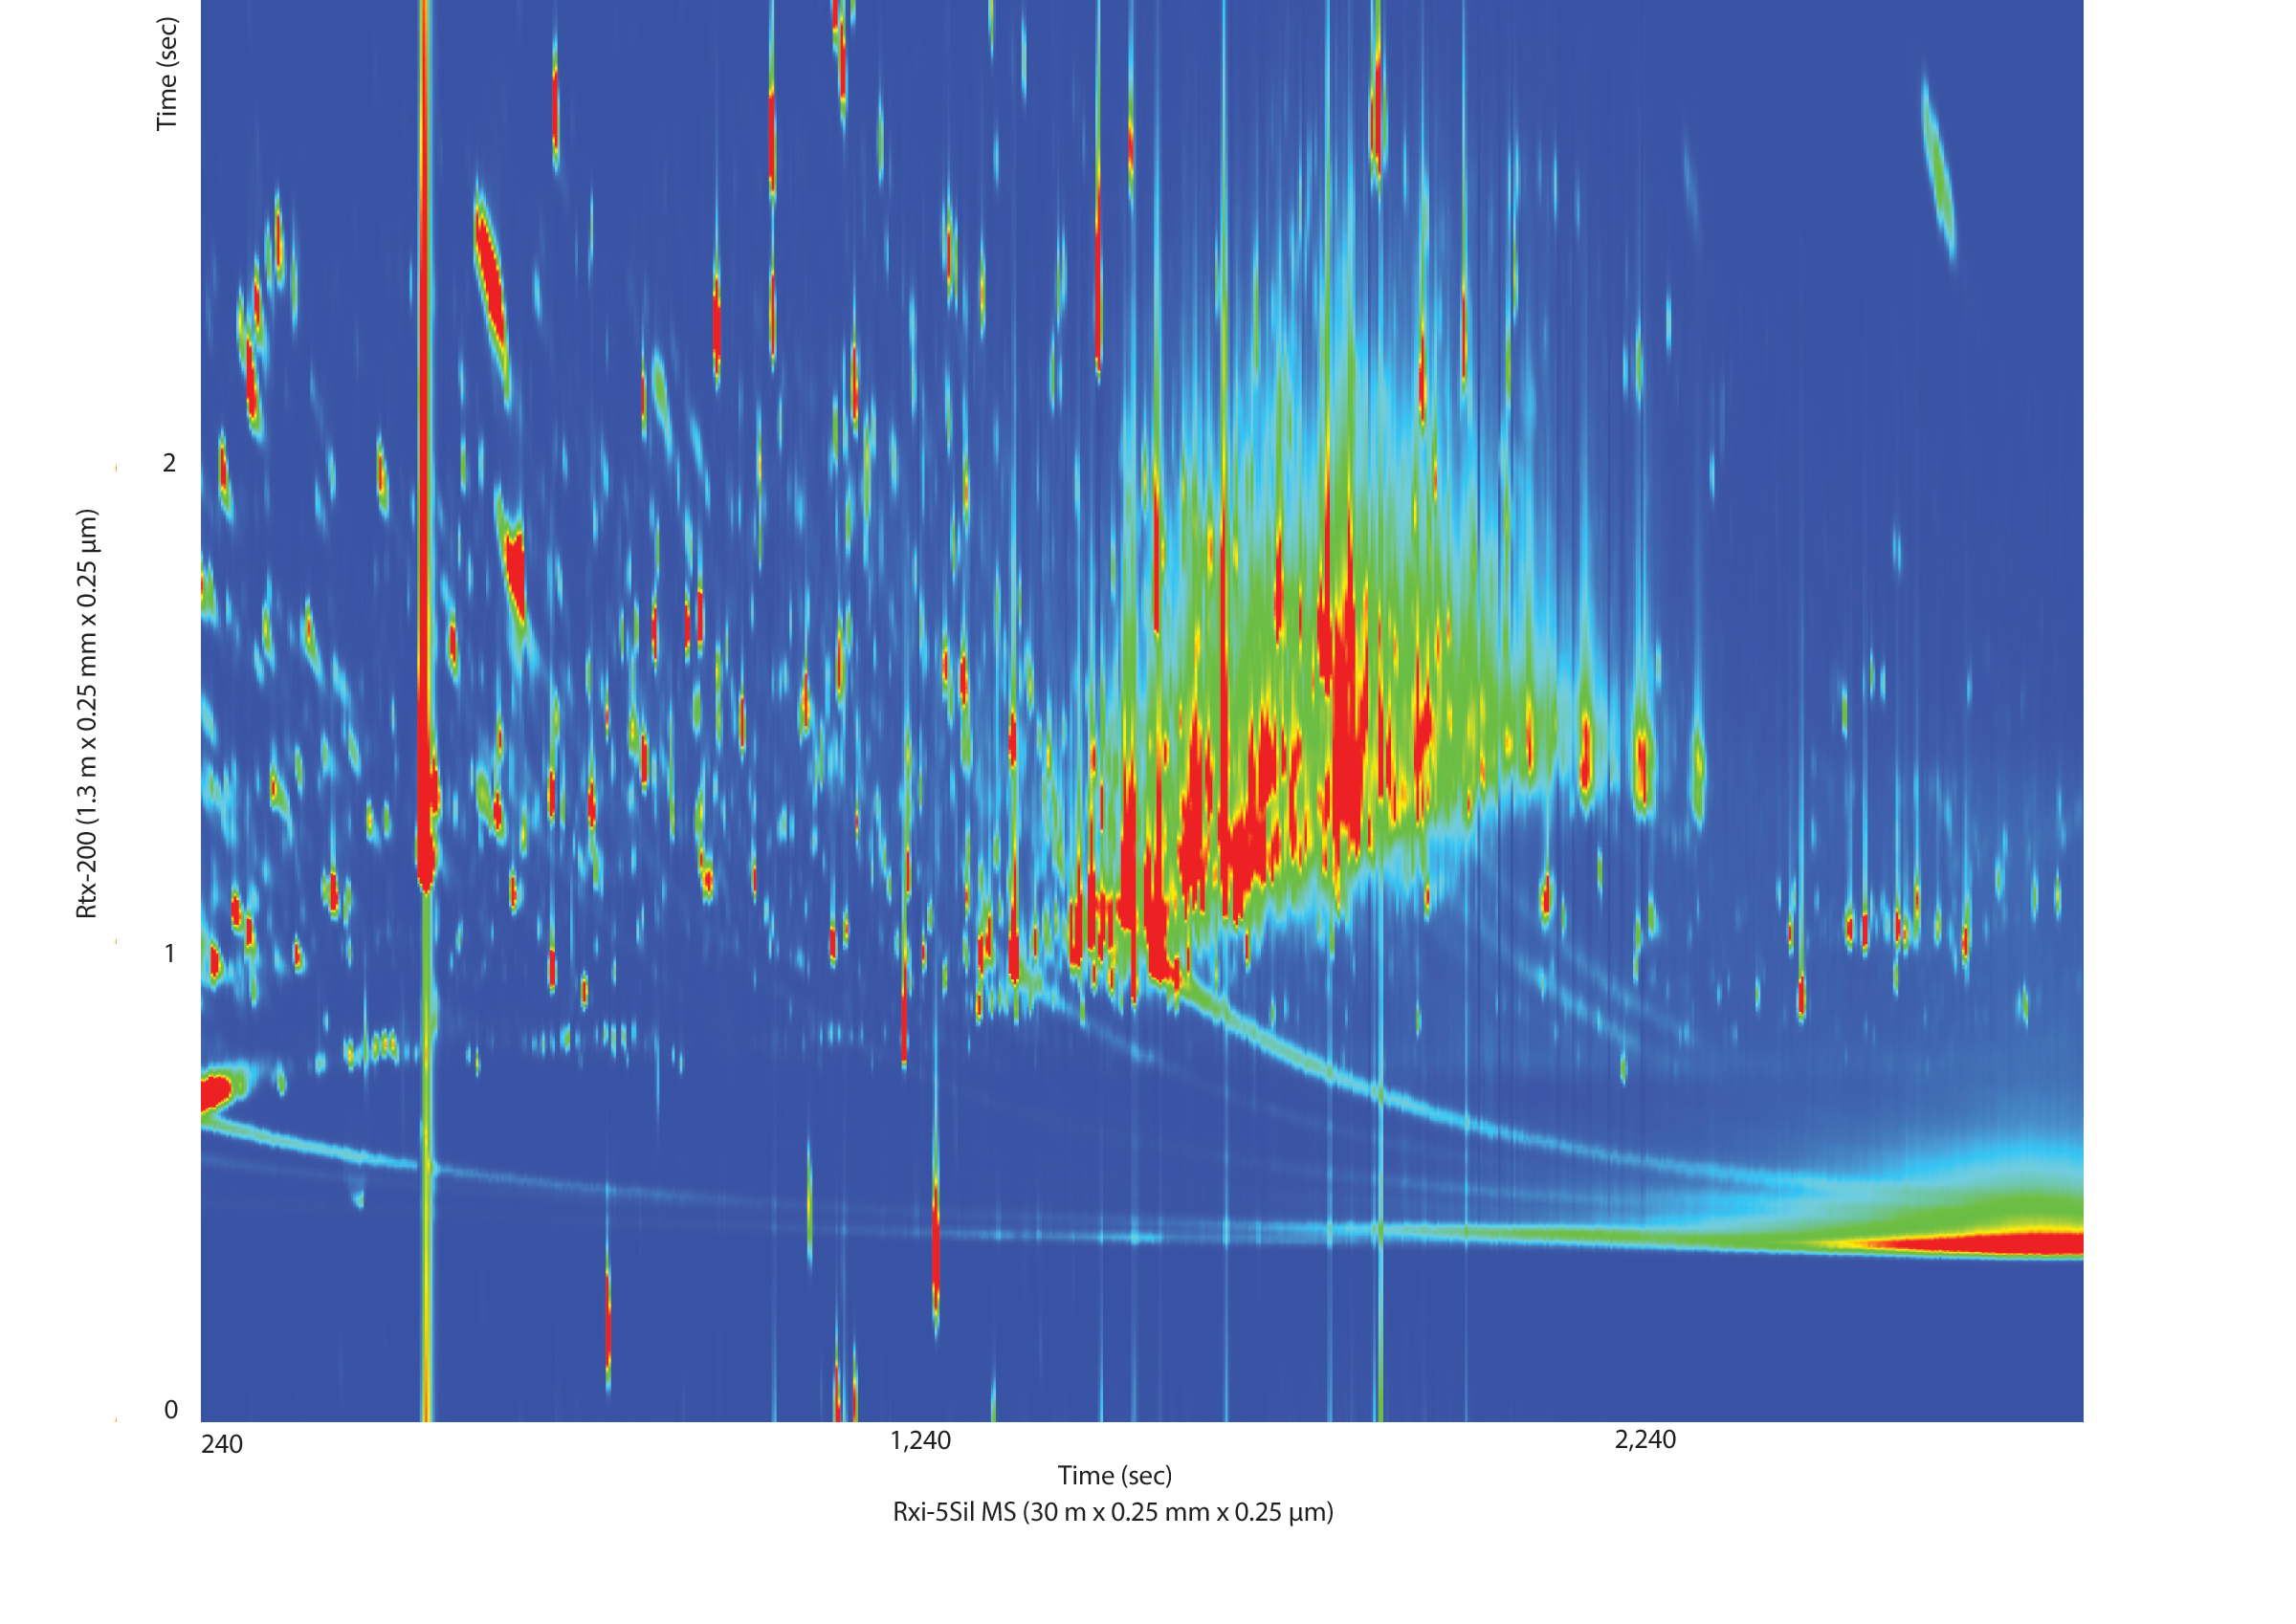
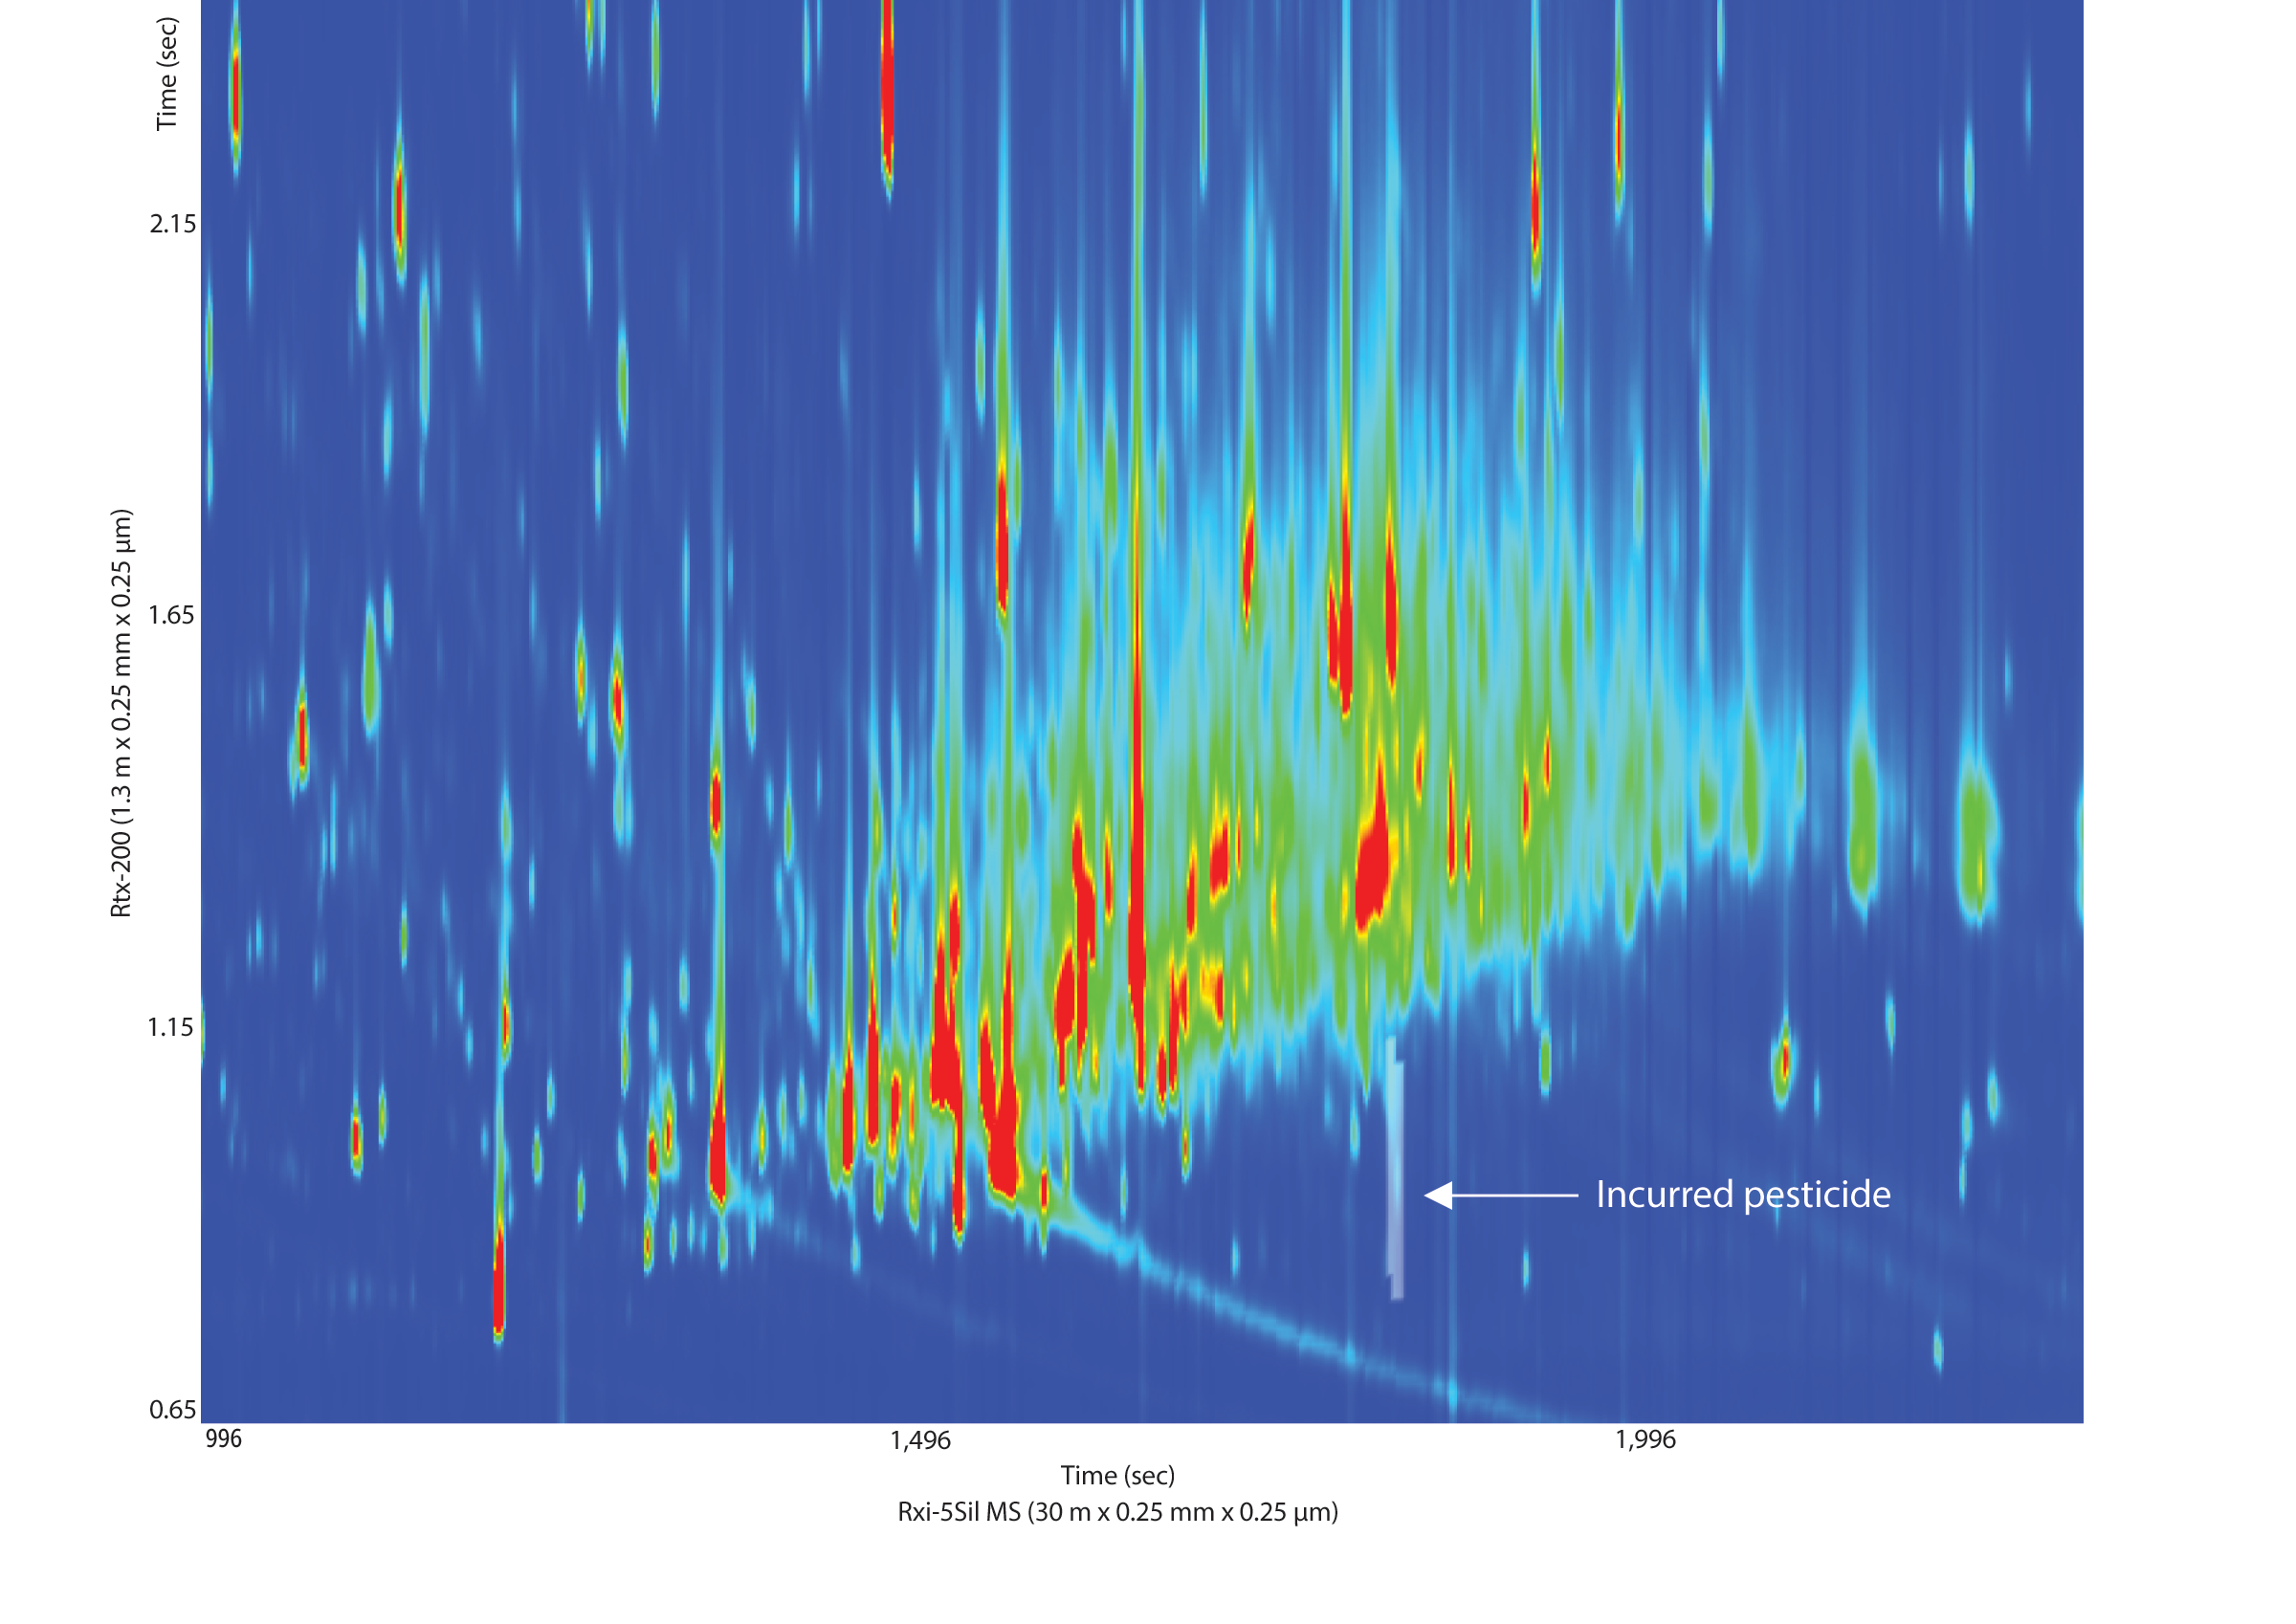
While the separation of pesticide standards is important, especially for isobaric interferences, separation of the matrix components from the pesticides of interest is even more important, especially given the concentration differential between gross matrix interferences and trace-level pesticides. The cigarette tobacco extract that we analyzed was a very complex sample, even after dSPE cleanup (Figure 4). The GCxGC separation of the tobacco matrix from the peaks of interest is what allowed us to use the faster, cheaper dSPE cleanup. This was especially apparent for one incurred pesticide that we found in the sample, piperonyl butoxide (Figure 5). In a 1D GC analysis, the peak of interest would have been completely obscured by matrix interferences that were not removed during cleanup.
Figure 4: GCxGC contour plot of an unfortified tobacco extract after dSPE cleanup with 25 mg PSA and 7.5 mg GCB highlights the complexity of the sample matrix.
See Figure 3 for instrument conditions.
Figure 5: Second dimension GCxGC separation of matrix components from the incurred pesticide piperonyl butoxide in an unfortified tobacco extract. The matrix would have coeluted and overwhelmed the piperonyl butoxide determination in a one-dimensional analysis.
See Figure 3 for instrument conditions.
Conclusion
When analyzing pesticides in tobacco, the QuEChERS extraction and dispersive solid phase extraction cleanup provided good recoveries for a wide range of residues at both the 500 ppb and 50 ppb fortification levels. We evaluated the more traditional cartridge solid phase extraction cleanup and found that it did not provide significantly greater removal of nonvolatile residues, except for fatty acids, compared to dSPE cleanup. GCxGC-TOFMS provided good separation of the complex matrix from the pesticides of interest. Without the use of GCxGC, determination of pesticide residues in such a complex matrix would have been difficult without a much more extensive cleanup.