Chromatographic Methods for Comprehensive Nitrosamine Impurity Analysis By LC-MS/MS
Nitrosamines are probable human carcinogens that can form during the manufacturing of active pharmaceutical ingredients (API) and drug products. These impurities are produced through nitrosation reactions between amines (secondary, tertiary, or quaternary amines) and nitrous acid. The recent discovery of nitrosamine contaminants in several classes of drugs, such as some angiotensin II receptor blockers, metformin, and ranitidine, prompted worldwide recalls and resulted in shortages of these important medicines. In response, risk assessment strategies for the detection and prevention of nitrosamine formation in drug products have been established.
Regulatory authorities (ICH, EMA, FDA) have identified several nitrosamine impurities that theoretically could be present in drug products [1]. The seven compounds on the FDA’s list are N-nitrosodimethylamine (NDMA), N-nitrosodiethylamine (NDEA), N-nitroso-N-methyl-4-aminobutanoic acid (NMBA), N-nitrosoisopropylethylamine (NEIPA), N-nitrosodiisopropylamine (NDIPA), N-nitrosodibutylamine (NDBA), and N-nitrosomethylphenylamine (NMPA). Analytical methods typically cover these compounds and a few others, but more comprehensive methods are needed because other potential nitrosamine impurities can form from the wide range of chemicals and processes that are used in drug production.
The goal of this study was to develop a flexible LC-MS/MS screening method that allows more comprehensive nitrosamine impurity analysis. To that purpose, our approach was designed to accommodate different sample preparation schemes utilizing various extraction solutions and sample diluents. In addition, we explored changes related to sample diluent and mobile phase compatibility that were necessary to ensure good chromatographic performance.
Column Selection and Establishment of Analytical Conditions
Initial column scouting experiments should always include a diverse array of stationary phase chemistries, so we evaluated Raptor Biphenyl, Raptor FluoroPhenyl, Raptor ARC-18, Ultra Aqueous C18, and Ultra IBD columns in the 100 x 2.1 mm format. For the mobile phase, we used 0.1% formic acid in water and methanol because it is commonly used for nitrosamines analysis. Results showed that the Raptor Biphenyl column had the best chromatographic performance, producing sharper peaks with higher peak intensity than the other columns. Since effective screening methods for nitrosamines need to be sensitive down to low ppb levels, the better peak shape and intensity seen on the Raptor Biphenyl column weighed heavily in column selection.
After the stationary and mobile phases had been determined, the method was further optimized on two column formats to provide method flexibility based on individual labs’ sample preparation process and instrumental capability. The established MRM transitions and optimal analytical conditions are shown in Tables I and II, respectively. Atmospheric pressure chemical ionization (APCI) was used to improve sensitivity, and during optimization we determined that the MS source temperature was the most important parameter in obtaining consistent MRMs and stronger signals. It also had significant impact on the peak shape of some nitrosamines. With the method established here, all 16 analytes had suitable detection signals at 1 ng/mL or less.
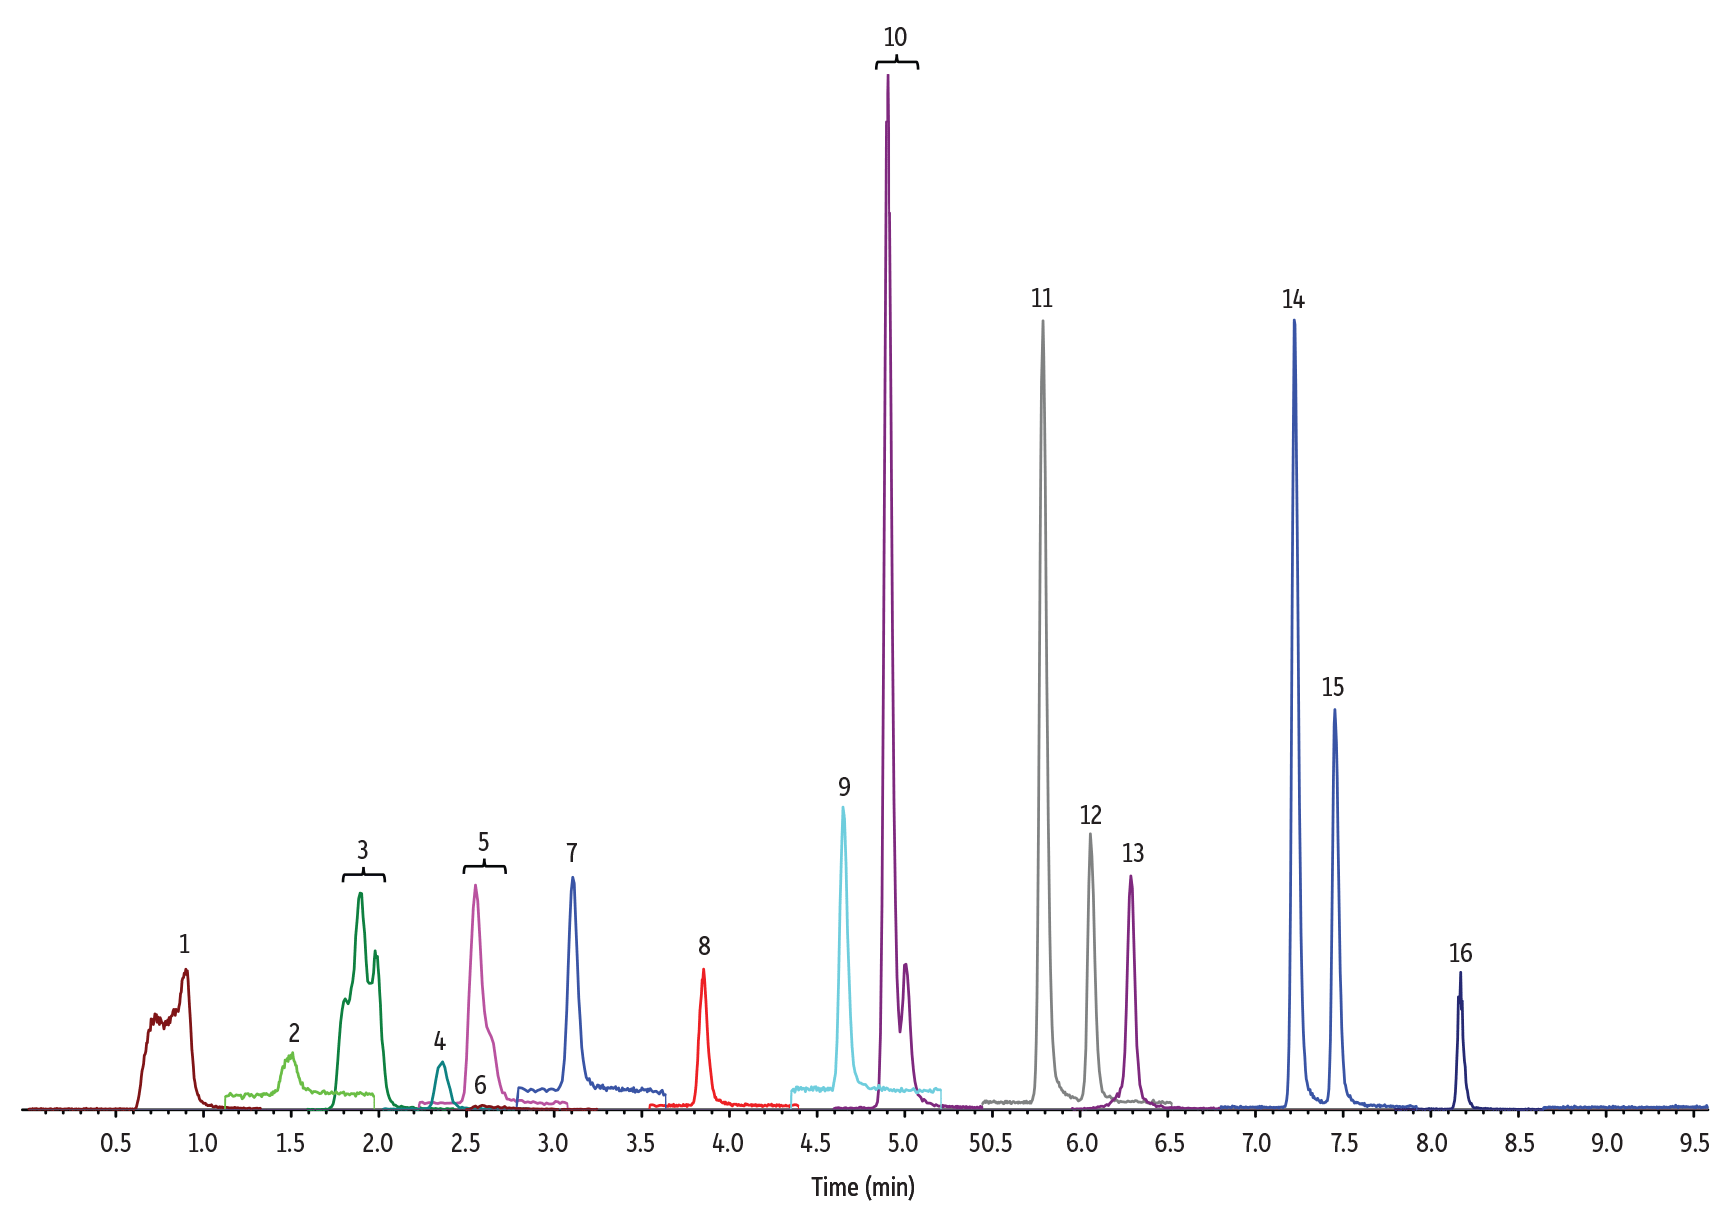
Even with these optimized conditions for comprehensive nitrosamine impurity analysis, we did observe peak splitting for NDIPLA and peak shoulders for NMBA, NMEA, and NEIPA (Figure 1). These phenomena have been reported in other nitrosamine methods and have been studied more extensively by Chang et al. [2].
Table I: Target Compounds and Ion Transitions for Comprehensive Nitrosamine Impurity Analysis by LC-MS/MS
| Peak # in Figures | Analytes | Precursor Ion | Product Ion | tR (min) (100 x 2.1 mm) |
tR (min) (100 x 3.0 mm) |
| 1 | N-Nitrosodiethanolamine(NDELA) | 135.1 | 74.0 | 0.90 | 1.15 |
| 2 | N-Nitrosodimethylamine (NDMA) | 75.1 | 58.0 | 1.52 | 1.74 |
| 3 | N-Nitrosodiisopropanolamine (NDIPLA) | 163.0 | 88.0 | 1.90 | 1.87 |
| 4 | N-Nitrosomorpholine (NMOR) | 117.1 | 45.2 | 2.38 | 2.45 |
| 5 | N-Nitrosomethylethylamine (NMEA) | 89.1 | 61.0 | 2.57 | 2.64 |
| 6 | N-Nitroso-N-methyl-4-aminobutyric acid (NMBA) | 147.1 | 117.0 | 2.61 | 2.51 |
| 7 | N-Nitrosopyrrolidine (NPYR) | 101.1 | 55.1 | 3.12 | 3.12 |
| 8 | N-Nitrosodiethylamine (NDEA) | 103.1 | 75.0 | 3.86 | 3.81 |
| 9 | N-Nitrosopiperidine (NPIP) | 115.1 | 69.0 | 4.66 | 4.60 |
| 10 | N-Nitrosoethylisopropylamine (NEIPA) | 117.1 | 75.0 | 4.91 | 4.78 |
| 11 | N-Nitrosodiisopropylamine (NDIPA) | 131.1 | 43.0 | 5.79 | 5.60 |
| 12 | N-Nitrosodipropylamine (NDPA) | 131.1 | 43.0 | 6.07 | 5.87 |
| 13 | N-Nitrosomethylphenylamine (NMPA) | 137.0 | 65.9 | 6.30 | 6.12 |
| 14 | N-Nitrosodiisobutylamine (NDIBA) | 159.1 | 57.1 | 7.23 | 6.94 |
| 15 | N-Nitrosodibutylamine (NDBA) | 159.1 | 57.1 | 7.46 | 7.16 |
| 16 | N-Nitrosodiphenylamine (NDPHA) | 199.1 | 169.0 | 8.17 | 7.88 |
Table II: Optimized Analytical Conditions for Two Column Formats
| Analytical Columns | Raptor Biphenyl 100 mm x 2.1 mm, 2.7 µm (cat.# 9309A12) Raptor Biphenyl 100 mm x 3.0 mm, 2.7 µm (cat.# 9309A1E) |
|||
| Instrument | Shimadzu Nexera X2 UHPLC coupled with SCIEX Triple Quad 4500 MS | |||
| Mobile Phase A | 0.1% Formic acid in water | |||
| Mobile Phase B | 0.1% Formic acid in methanol | |||
| Gradient | 100 x 2.1 mm | 100 x 3.0 mm | ||
| Time (min) | %B | Time (min) | %B | |
| 0.00 | 5 | 0.00 | 15 | |
| 9.00 | 95 | 8.00 | 85 | |
| 9.01 | 5 | 8.01 | 15 | |
| 11.0 | 5 | 10.0 | 15 | |
| Flow Rate | 0.4 mL/min | 0.5 mL/min | ||
| Column Temp. | 40 °C | |||
| Ion Mode | Positive APCI | |||
| Curtain Gas | 30 psi | |||
| Collision Gas | 8 | |||
| Nebulizer Current | 1 µA | |||
| Ion Source Gas 1 | 50 psi | |||
| Source Temp. | 220 °C | |||
Effect of Sample Diluent, Injection Volume, and Column Format on Chromatographic Performance
Because sample preparation methods will vary based on differences in drug matrices, our goal was to produce a method that was compatible with a wide range of sample diluents from aqueous to organic solutions. For this, we tested 100% water, 50:50 water:methanol, and 100% methanol as diluents and evaluated their impact on chromatographic performance. Mismatch between the sample diluents and starting mobile phase condition can greatly affect peak shape, intensity, and resolution, so we also tested different injection volumes on different column formats to determine which combination produced the best chromatographic results.
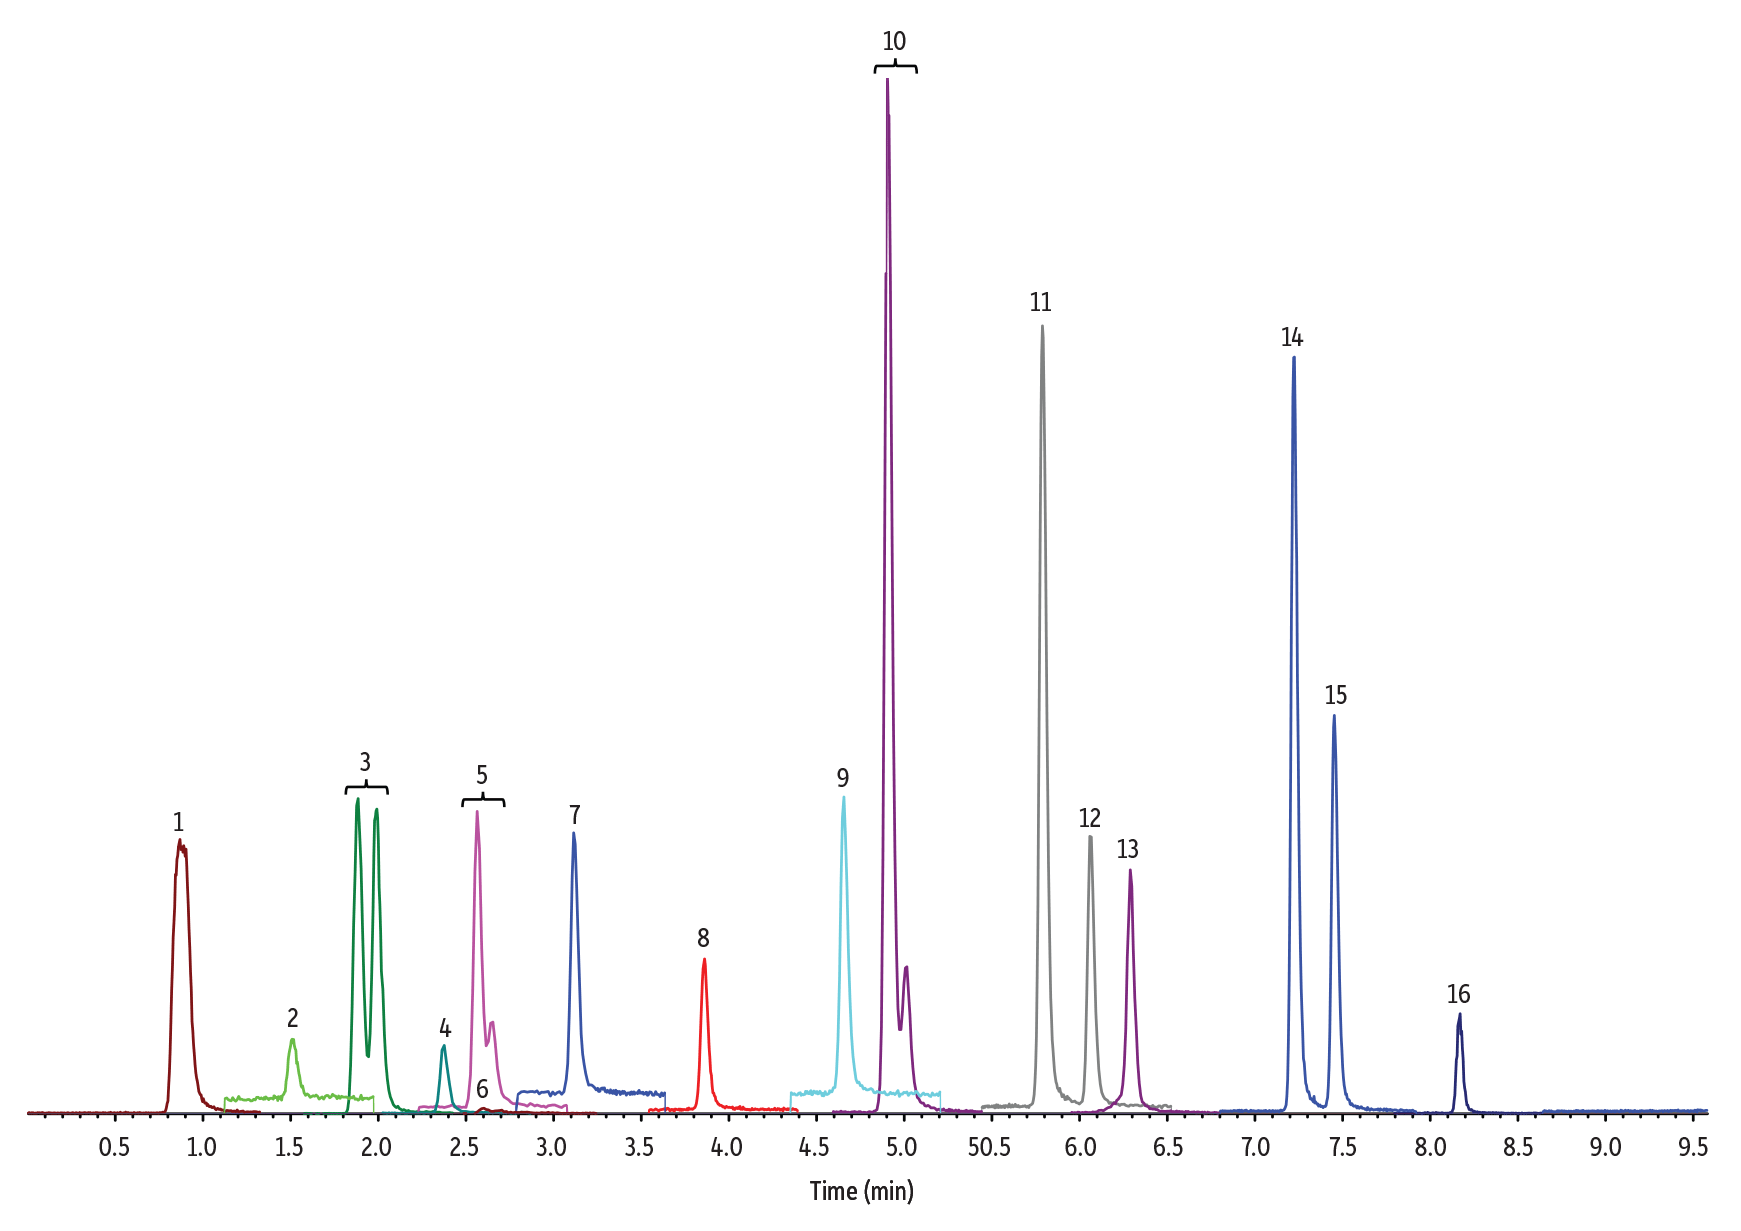
Through these experiments, it was immediately clear that the peak shapes of early eluting compounds were greatly impacted by the diluents used. On the smaller 100 x 2.1 mm column format, the mismatch of the starting mobile phase (5% methanol) and diluents with higher methanol concentration (50% or 100%) required that a lower injection volume (3 µL) be used to obtain acceptable peak shapes, especially for early eluting compounds such as NDELA and NDIPLA. When the larger column format (100 x 3.0 mm) was tested in an attempt to reduce the mismatching effect, larger injection volumes could be used without negatively affecting the peak shapes. In addition, with the larger column it was possible to use a higher organic starting mobile phase (15% methanol), which improved the peak shapes for early eluting compounds when diluted in 50:50 water:methanol or 100% methanol. A comparison of the chromatographic performance of the three diluents analyzed on 100 x 2.1 mm and 100 x 3.0 mm columns using optimized conditions for each is shown in Figures 1–3.
Use of a larger column and smaller injection volume are strategies that can reduce the impact of mismatched sample diluents and mobile phases. However, detection sensitivity for NDMA and NMBA was slightly reduced on the larger column. All versions of the method developed here provided good chromatographic performance for comprehensive nitrosamine impurity analysis, but which one is most appropriate should be determined by individual labs based on the sensitivity of their MS system and list of target compounds.
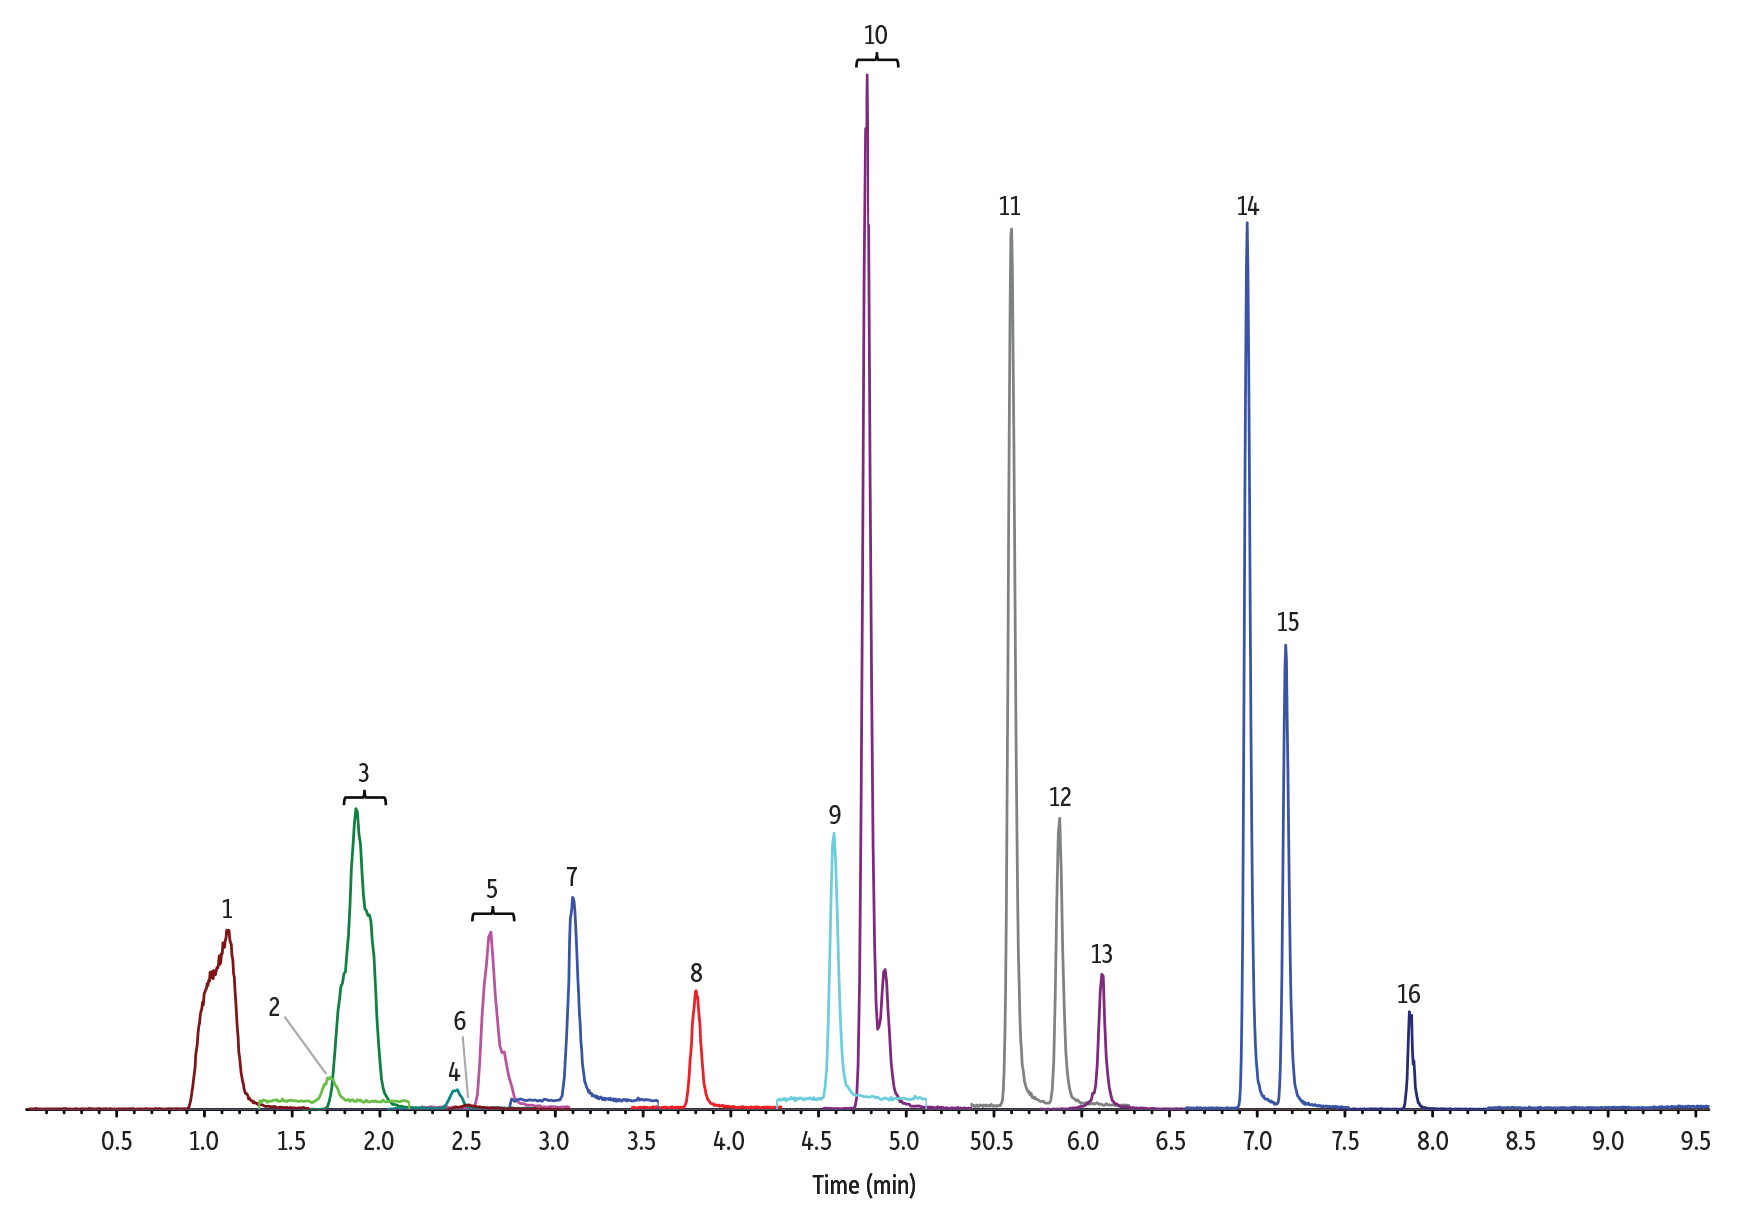
Figure 1: 10 ng/mL Nitrosamines Diluted in Water
(See Table I for peak identifications.)
5 µL Injection on 100 x 2.1 mm Raptor Biphenyl (Initial Mobile Phase: 5% B, 0.4 mL/min)
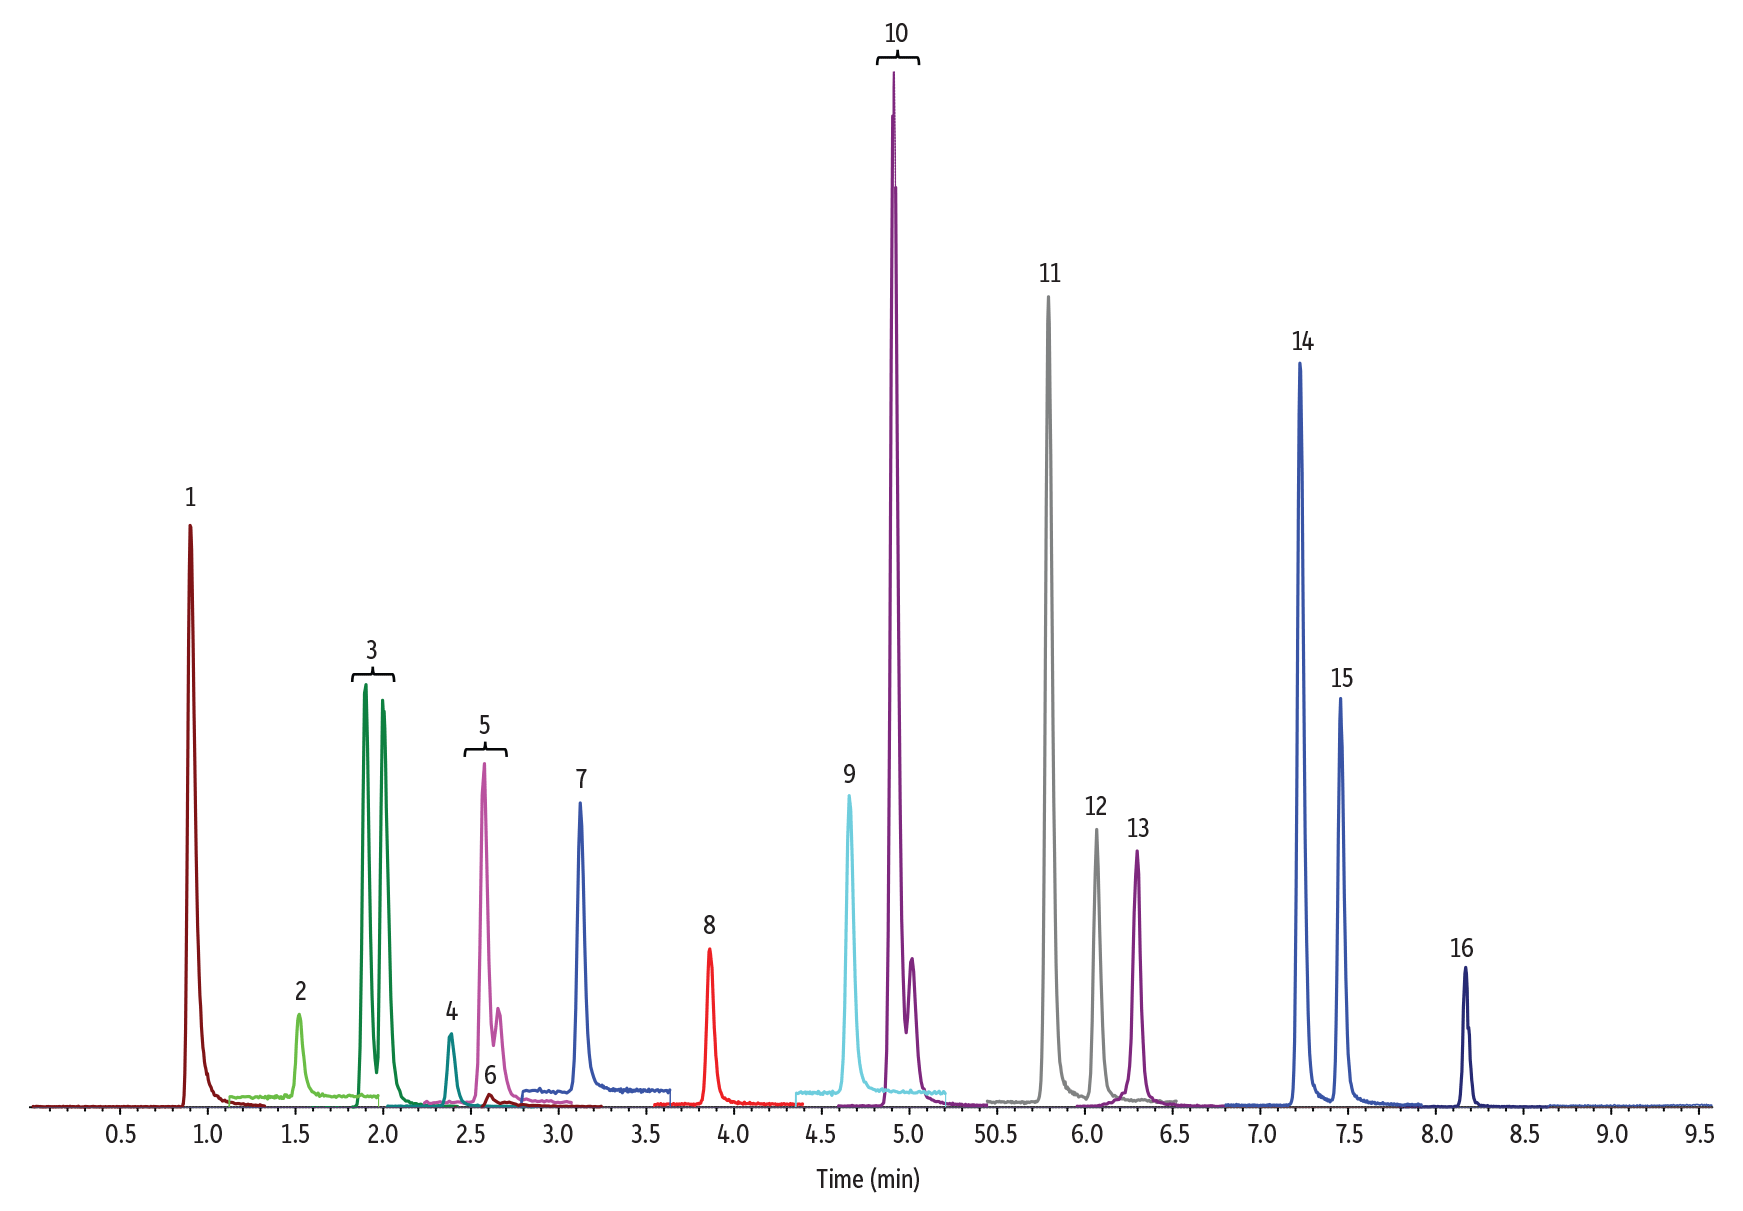
5 µL Injection on 100 x 3.0 mm Raptor Biphenyl (Initial Mobile Phase: 15% B, 0.5 mL/min)
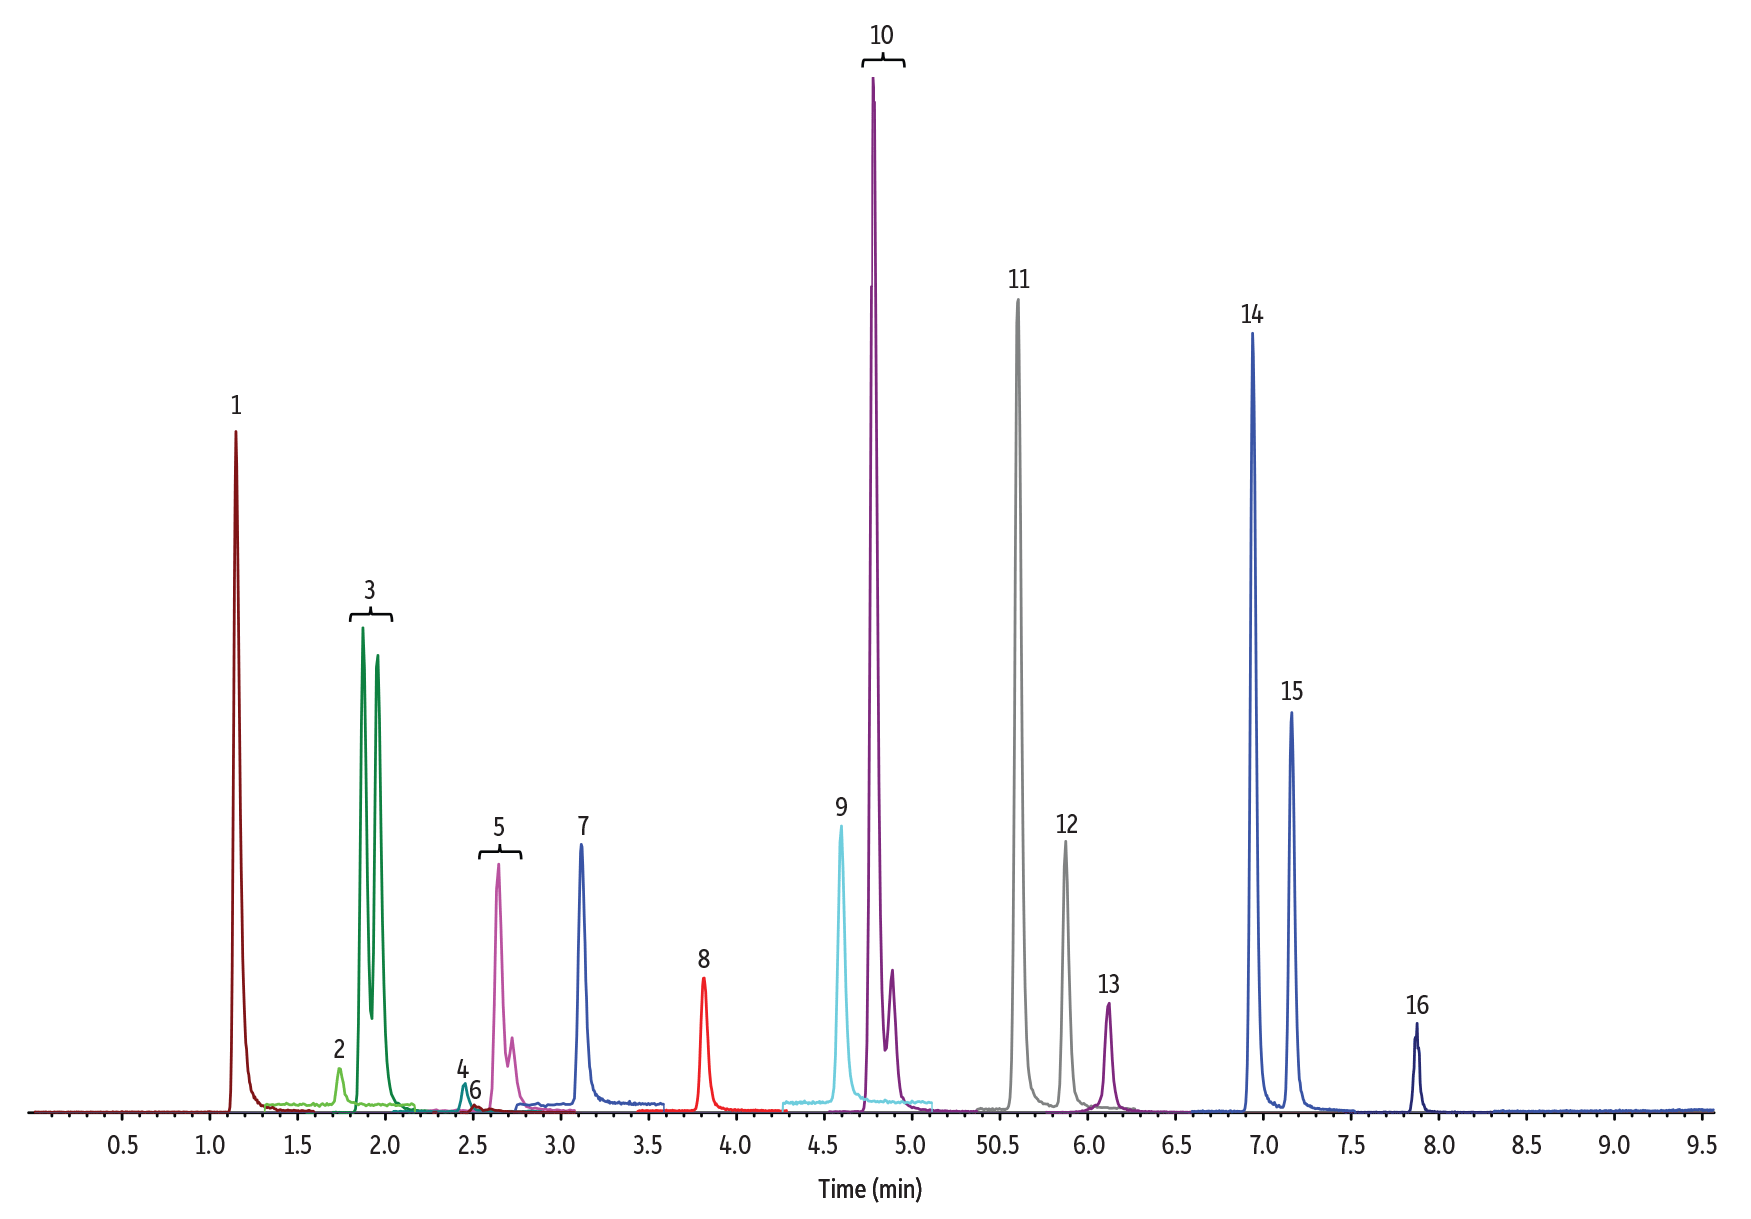
Figure 2: 10 ng/mL Nitrosamines Diluted in 50:50 Methanol:Water
(See Table I for peak identifications.)
3 µL Injection on 100 x 2.1 mm Raptor Biphenyl (Initial Mobile Phase: 5% B, 0.4 mL/min)
5 µL Injection on 100 x 3.0 mm Raptor Biphenyl (Initial Mobile Phase: 15% B, 0.5 mL/min)
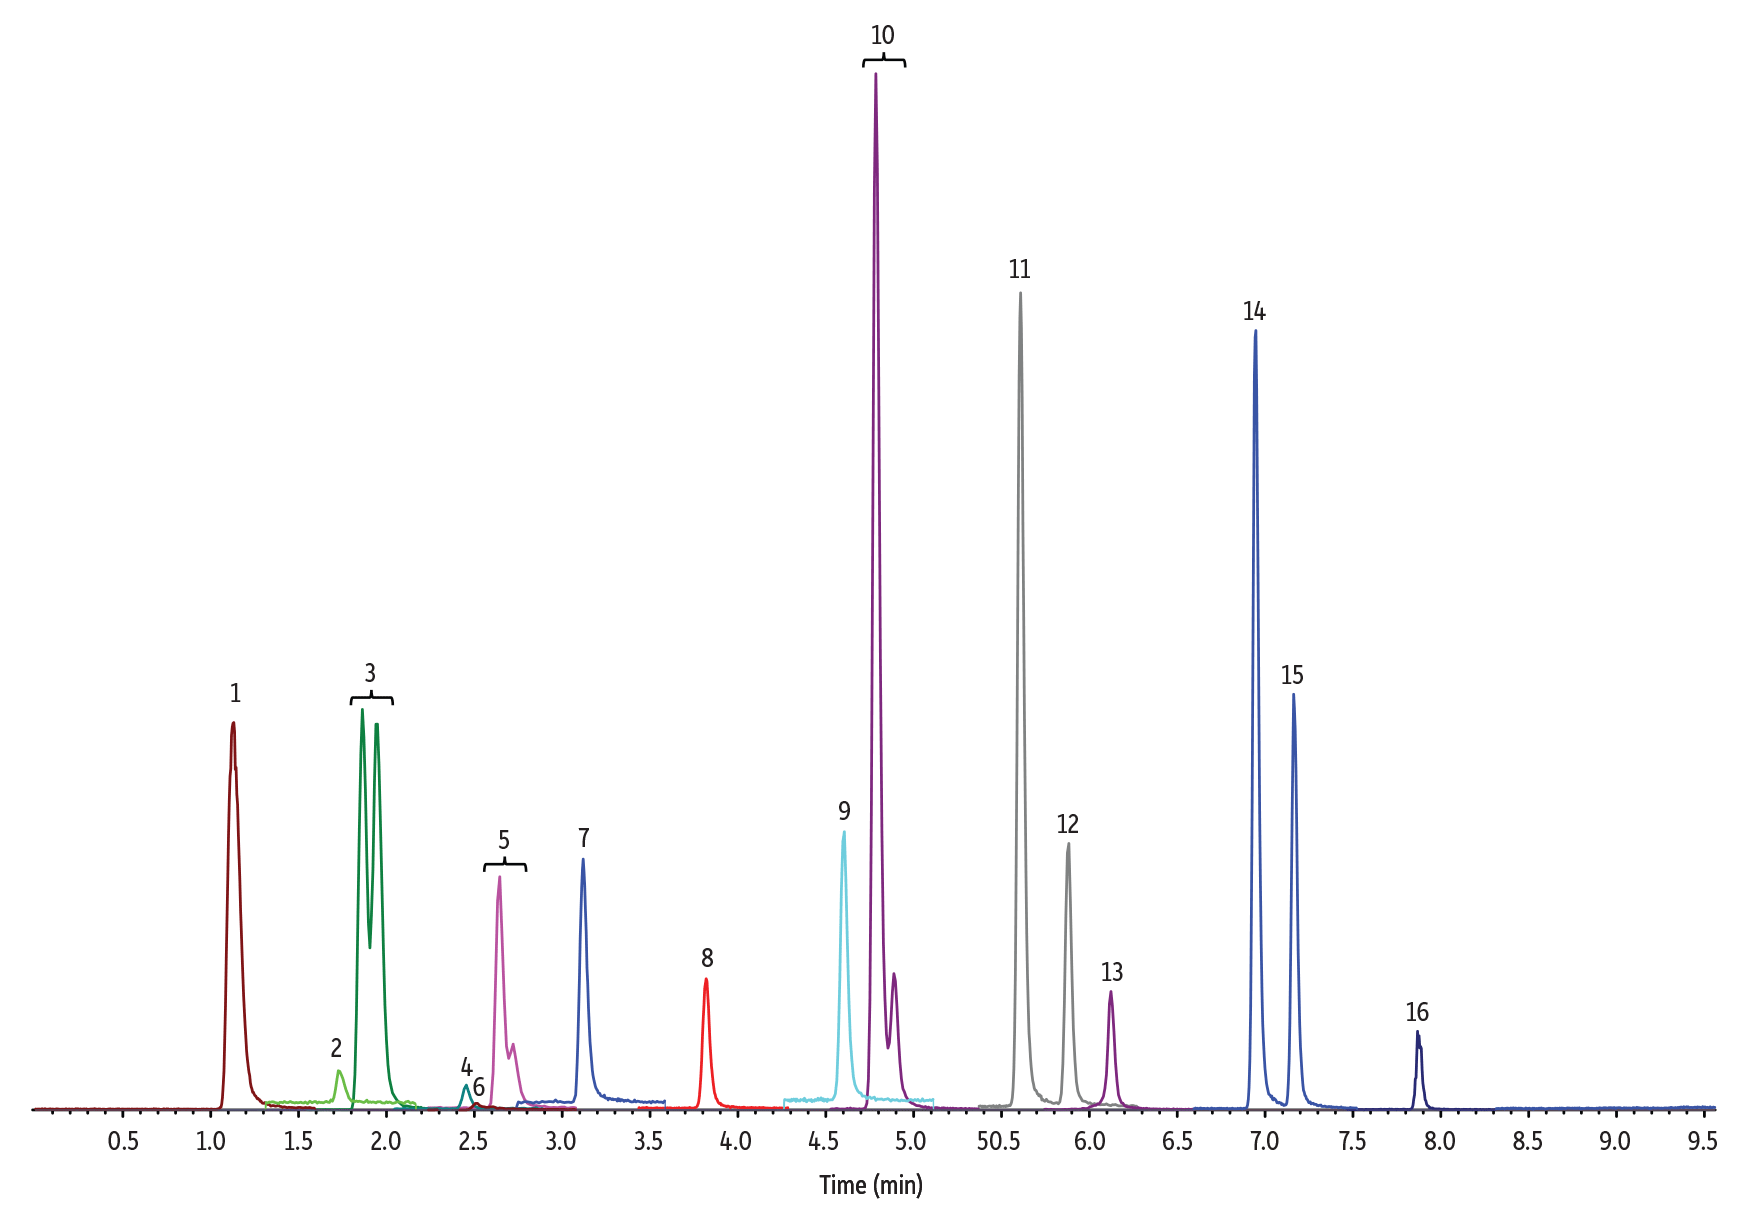
Figure 3: 10 ng/mL Nitrosamines Diluted in Methanol
(See Table I for peak identifications.)
3 µL Injection on 100 x 2.1 mm Raptor Biphenyl (Initial Mobile Phase: 5% B, 0.4 mL/min)
5 µL Injection on 100 x 3.0 mm Raptor Biphenyl (Initial Mobile Phase: 15% B, 0.5 mL/min)
Conclusion
Due to the wide range of APIs, drug matrices, and manufacturing processes, demand is growing for more comprehensive nitrosamine impurity analysis methods. Sample solubility, as well as compatibility between the sample diluent and starting mobile phase composition, are critical factors in method success. For that reason, we developed an approach that can accommodate disparate sample diluents (100% water, 50:50 water:methanol, 100% methanol) and still provide good chromatographic performance for 16 nitrosamines. The LC-MS/MS methods described here use a Raptor Biphenyl column in two formats (100 x 2.1 mm and 100 x 3.0 mm) with injection volumes and mobile phases that are optimized to minimize solvent mismatch for each diluent. While all versions produced good chromatographic results, the choice of method should be determined by each lab based on their specific target nitrosamines list and the sensitivity capabilities of their LC-MS/MS instrumentation.
References
[1] U.S. Food and Drug Administration. FDA Guidance Document: Control of Nitrosamine Impurities in Human Drugs, 2020. https://www.fda.gov/regulatory-information/search-fda-guidance-documents/control-nitrosamine-impurities-human-drugs
[2] S-H. Chang, C-C. Chang, L-J. Wang, W-C. Chen, S-Y. Fan, C-Z. Zang, Y-H. Hsu, M-C. Lin, S-H. Tseng, and D-Y. Wang, A multi-analyte LC-MS/MS method for screening and quantification of nitrosamines in sartans, Journal of Food and Drug Analysis, 28 (2020) 292-301. https://www.jfda-online.com/cgi/viewcontent.cgi?article=1063&context=journal