Large Volume Splitless Injection Using an Unmodified Split/Splitless Inlet and GC-TOFMS for Pesticides and Brominated Flame Retardants
Abstract
Large volume splitless injection for gas chromatography typically requires a special injection port, for example, a programmable temperature vaporizer (PTV), but an alternative setup using concurrent solvent recondensation–large volume splitless injection (CSR-LVSI) and a split/splitless injection port has been reported. This technique was used here, both with and without sample extract concentration, to analyze pesticides and brominated flame retardants in drinking water. When extract concentration was eliminated, good linearity and recovery results were obtained while sample preparation time was reduced by over 1 hour. CSR-LVSI was also combined with extract concentration to achieve lower detection limits.
Introduction
Using large volume splitless injection in gas chromatography (GC) is advantageous when trying to analyze trace-level contaminants in clean matrices like drinking water because greater levels of target compounds are introduced onto the analytical column. A special injection port is generally required for large volume injection, which has limited its practical application. However, concurrent solvent recondensation–large volume splitless injection (CSR-LVSI), a technique described by Magni and Porzano, has been done in a split/splitless injection port that was slightly modified [1,2]. This technique utilizes a pre-column (e.g., 5 m x 0.53 mm) press-fitted to the analytical column and a starting GC oven temperature below the boiling point of the solvent. A fast autosampler injection with liquid band formation into a liner containing glass wool is used to prevent backflash in the injection port [3].
This injection method produces a pressure surge from the vaporizing solvent, forcing the analytes onto the pre-column. Recondensation of solvent takes place in the pre-column, which effectively focuses the analytes at the beginning of the analytical column. CSR-LVSI results in narrow peaks, allowing both column efficiency and critical pair resolution to be maintained. Application chemists at Thermo Scientific have successfully applied the CSR-LVSI technique to drugs of abuse screening, pesticides, and polychlorinated biphenyls by injecting 20–35 µL, significantly improving limits of detection [5,6,7]. CSR-LVSI has been used successfully in our lab, but without any modification of the split/splitless inlet, for the analysis of polycyclic aromatic hydrocarbons (PAHs), total petroleum hydrocarbons (TPH), EPA Method 8270 semivolatiles, organochlorine pesticides, and pesticides in dandelion root extract. Here we investigated its applicability for analyzing pesticides and brominated flame retardants in drinking water according to US EPA Method 527 [4].
The typical procedure for preparing samples for analysis according to EPA Method 527 involves extracting a 1 L water sample, drying the extract, and concentrating the extract down to a final volume of 1 mL. Our work assessed the potential for CSR-LVSI to eliminate the time-consuming extract concentration step and also demonstrated the use of LVSI in combination with extract concentration as a way to lower detection limits.
Experimental
CSR-LVSI Without Extract Concentration
To determine if CSR-LVSI could preclude the need for extract concentration, recovery experiments were performed using triplicate preparations of deionized water fortified at 0.1 µg/L and 1 µg/L levels. For each fortified sample, 1 L of deionized water was collected in a clean, amber bottle and preserved with 0.10 g ascorbic acid, 0.35 g ethylenediaminetetraacetic acid (EDTA) trisodium salt, and 9.4 g potassium dihydrogen citrate. A surrogate standard (Surrogate Standard, Method 527 [cat.# 33009]) was then added at 0.1 µg/L and 1 µg/L. Fortified samples were prepared at 0.1 µg/L and 1 µg/L with a mixture containing pesticide and polybrominated diphenyl ether (PBDE) standards (Pesticides Mix #1, Method 527 [cat.# 33007]; Pesticides Mix #2, Method 527 [cat.# 33008]; and PBDE Mix [cat.# 33098]).
Each sample was extracted using a polystyrenedivinylbenzene Resprep Resin SPE Disk (cat.# 26023) following EPA Method 527 protocol. Extracts were dried with anhydrous sodium sulfate and diluted to a final volume of 25 mL with methylene chloride:ethyl acetate (1:1). This differs from the method, which calls for the samples to be concentrated to 1 mL after drying. Prior to analysis, 1 mL aliquots were spiked with 10 µL of an internal standard (Internal Standard, Method 527 [cat.# 33010]), resulting in a concentration of 40 pg/µL in the final extract. In order to achieve the detection limits described in the method, a 12.5 µL injection volume with GC/MS was used.
A 6-point calibration curve from 25 to 1,000 pg on-column was used to establish linearity and quantify samples (Table I).
Table I: Calibration standards and concentration equivalents.
| Level | Prepared Standard (pg/µL) | On-Column Amount Injected (pg/12.5 µL) |
Equivalent Concentration in 1 L Samples (µg/L) |
| 1 | 2 | 25 | 0.05 |
| 2 | 4 | 50 | 0.1 |
| 3 | 10 | 125 | 0.25 |
| 4 | 20 | 250 | 0.5 |
| 5 | 40 | 500 | 1 |
| 6 | 80 | 1,000 | 2 |
CSR-LVSI With Extract Concentration
The purpose of the second experiment was to determine if detection limits could be lowered by using CSR-LVSI in combination with extract concentration. To perform this test we used water samples collected from Spring Creek in State College, PA. This creek is well-known for fly fishing for trout, but became contaminated with Kepone and Mirex several decades ago [8]. Remediation has significantly reduced pesticide levels, making lower detection limits a key part of monitoring efforts. For this experiment we collected 4 x 1 L water samples and followed the preservation, extraction, and drying steps described in the first experiment. After all extracts were passed through the drying column, they were combined and concentrated to just below 1 mL using a heated water bath and a stream of dry nitrogen gas. The extracts were then diluted to 1 mL final volume with methylene chloride:ethyl acetate (1:1). A 12.5µL injection was again employed.
GC/MS Conditions
A fast autosampler injection with an Agilent 7683 injector was used to make large volume (12.5 µL) injections from a 25 µL SGE large volume autosampler syringe (cat.# 24798). A 4 mm single gooseneck liner with semivolatiles wool (cat.# 20799-231.5) placed at the bottom of the liner was installed into an unmodified Agilent 6890 split/splitless injection port at 250 °C. The purge valve time was 35 seconds. A deactivated 5 m x 0.53 mm ID pre-column retention gap/guard column (cat.# 10045) was installed in the injector and press-fitted (deactivated Universal Press-Tight connector cat.# 20429) to a 15 m x 0.25 mm x 0.25 µm Rxi-5Sil MS column (cat.# 13620). The oven was programmed from 40 °C (0.6 min. hold) to 320 °C (1.07 min. hold) at 30 °C/min., with a corrected constant flow of 2 mL/min. helium carrier gas. All analyses were performed on a LECO Pegasus GC with a time-of-flight mass spectrometer (TOFMS). A reagent blank was included in each analytical set.
Results and Discussion
Establishing Linearity and Recovery Using CSR-LVSI Without Sample Concentration
Calibration curves for all compounds, including Kepone (Figure 1), which can be problematic due to the formation of a hemiacetal that chromatographs poorly, exhibited good linearity down to 2 pg/µL (equivalent to 25 pg on-column and 0.05 µg/L in sample). Good chromatographic separations were obtained and the 15 m GC column and fast oven program resulted in an analysis time of less than 10 minutes (Figure 2).
Figure 1: Kepone calibration curve from 2 to 80 pg/µL (25 to 1,000 pg on-column).
Figure 2: Extracted ion chromatogram of 80 pg/µL standard.
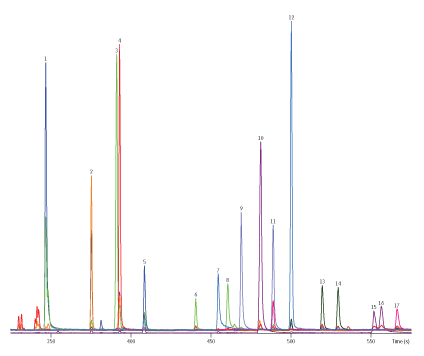
| Peaks | |
|---|---|
| 1. | Atrazine |
| 2. | Vinclozoline |
| 3. | Malathion |
| 4. | Chlorpyrifos |
| 5. | Terbufos sulfone |
| 6. | Nitrofen |
| 7. | Kepone |
| 8. | Norflurazon |
| Peaks | |
|---|---|
| 9. | Triphenyl phosphate |
| 10. | Bifenthrin |
| 11. | BDE-47 |
| 12. | Mirex |
| 13. | BDE-100 |
| 14. | BDE-99 |
| 15. | Fenvalerate |
| 16. | Esfenvalerate |
| 17. | BDE-153 |
| Column | Rxi-5Sil MS, 15 m, 0.25 mm ID, 0.25 µm (cat.# 13620) |
|---|---|
| using IP Deactivated Guard Column 5 m, 0.53 mm ID (cat.# 10045) | |
| with Universal Press-Tight Connectors (cat.# 20429) | |
| Standard/Sample | PBDE Mix (cat.# 33098) |
| Pesticides Mix #1, Method 527 | |
| Pesticides Mix #2, Method 527 (cat.# 33008) | |
| Internal Standard, Method 527 (cat.# 33010) | |
| Surrogate Standard, Method 527 | |
| Diluent: | ethyl acetate:methylene chloride (1:1) |
| Conc.: | 80 pg/µL (1 ng on-column) |
| Injection | |
| Inj. Vol.: | 12.5 µL splitless (hold 0.583 min) |
| Liner: | Gooseneck Splitless (4 mm) w/Semivolatiles Wool (cat.# 20799) |
| Inj. Temp.: | 250 °C |
| Purge Flow: | 40 mL/min |
| Oven | |
| Oven Temp.: | 40 °C (hold 0.60 min) to 320 °C at 30 °C/min (hold 1.07 min) |
| Carrier Gas | He, constant flow |
| Flow Rate: | 2 mL/min |
| Detector | MS |
|---|---|
| Mode: | |
| Transfer Line Temp.: | 290 °C |
| Analyzer Type: | TOF |
| Source Temp.: | 225 °C |
| Electron Energy: | -70 eV |
| Mass Defect: | -20 mu/100 u |
| Solvent Delay Time: | 3.33 min |
| Acquisition Range: | 45 - 750 amu |
| Spectral Acquisition Rate: | 10 spectra/sec |
| Instrument | LECO Pegasus 4D GCxGC-TOFMS |
| Notes | Standards cat.# 33007 and 33009 were used to produce this chromatogram, but have since been discontinued. For assistance choosing a replacement for this application, contact Restek Technical Service or your local Restek representative. - - - - - - Carrier Gas Flow: 2 mL/min. corrected constant flow via pressure ramps |
Following the CSR-LVSI without extract concentration procedure, a 1 µg/L fortified sample that was extracted, with the extract dried and diluted to 25 mL, results in a 40 pg/µL final concentration assuming 100% recovery for the sample preparation (1 µg/25 mL = 0.04 µg/mL = 40 pg/µL). A 12.5 µL injection of the 40 pg/µL sample results in 500 pg on-column. In contrast, by following Method 527, a 1 µg/L sample taken through the extraction, drying and concentration steps to 1 mL yields a final extract concentration of 1 ng/µL. Injecting 1 µL results in 1 ng (1,000 pg) on-column.
The 1 µg/L (40 pg/µL) fortification represented a sample near the high end of the calibration curve and recovery results must be between 70% and 130% of the true value based on Method 527. Since the detection limit estimates noted in Method 527 for analytes in reagent water range from 0.022 to 0.140 µg/L [4], we also analyzed 0.1 µg/L samples. The 0.1 µg/L samples (4 pg/µL in the extract if 100% recovery) approached our detection limit for some compounds, especially the late-eluting PBDEs. For the 0.1 µg/L samples, recoveries must be 50-150% of the true value. The average recoveries for all compounds for the 1 µg/L (500 pg on-column) and 0.1 µg/L (50 pg on-column) spikes were quite good at 94% and 80%, respectively (Table II). Individual recoveries met EPA Method 527 criteria, except for the 0.1 µg/L value for hexabromobiphenyl 153 (BB-153) and the 1.0 µg/L value for prometryne. Recovery results demonstrated that employing CSR-LVSI and eliminating the concentration step can be an effective way to meet detection limits while reducing sample preparation time by more than an hour for Method 527.
When large injection volumes are used in either splitless or direct injection, backflash can be a concern. Backflash, the phenomenon of solvent vapor volume exceeding the volume of the injection port liner, can cause carryover, poor reproducibility, and a non-linear increase in peak area with increasing injection volume. While backflash depends on multiple factors, including GC column head pressure, solvent type, injection volume, and injection temperature, none of the deleterious effects associated with it were observed when using CSR-LVSI with the unmodified splitless GC inlet.
Table II: Average percent recoveries and relative standard deviations for 1 µg/L and 0.1 µg/L laboratory fortified blank samples analyzed using disk extraction with no extract concentration and CSR-LVSI GC-TOFMS (n = 3).
| 1 µg/L % Recovery | 0.1 µg/L % Recovery | |||
| Compounds | AVG (n = 3) | %RSD | AVG (n = 3) | %RSD |
| Dimethoate | 73 | 2.4 | 75 | 9.3 |
| Atrazine | 96 | 1.8 | 84 | 13 |
| Propazine | 93 | 3.3 | 92 | 8.5 |
| Vinclozoline | 97 | 4.0 | 97 | 8.0 |
| Prometryne | 179 | 3.0 | 113 | 7.9 |
| Bromacil | 78 | 2.2 | 66 | 3.1 |
| Malathion | 98 | 2.7 | 85 | 6.5 |
| Thiobencarb | 93 | 3.9 | 70 | 1.9 |
| Chlorpyrifos | 92 | 3.1 | 84 | 1.7 |
| Parathion | 94 | 0.7 | 92 | 4.6 |
| Terbufos sulfone | 88 | 2.8 | 105 | 11 |
| Oxychlordane | 75 | 8.5 | 74 | 10 |
| Esbiol | 88 | 2.7 | 79 | 6.5 |
| Nitrofen | 91 | 3.0 | 77 | 5.3 |
| Kepone | 102 | 18 | 56 | 32 |
| Norflurazon | 91 | 7.2 | 105 | 10 |
| Hexazinone | 87 | 0.8 | 68 | 2.1 |
| Bifenthrin | 100 | 3.0 | 81 | 3.2 |
| BDE-47 | 96 | 4.4 | 87 | 15 |
| Mirex | 93 | 4.5 | 76 | 2.3 |
| BDE-100 | 93 | 3.8 | 89 | 11 |
| BDE-99 | 93 | 2.9 | 79 | 33 |
| Perylene-D12 | 103 | 1.6 | 98 | 3.3 |
| Fenvalerate | 92 | 0.4 | 59 | 16 |
| BB-153 | 88 | 3.4 | 45 | 14 |
| Esfenvalerate | 89 | 3.7 | 69 | 20 |
| BDE-153 | 88 | 13 | 54 | 49 |
Combining CSR-LVSI With Extract Concentration for Lower Detection Limits
One advantage of using CSR-LVSI for Method 527 is that the time-consuming extract concentration step can be avoided, as demonstrated above. Eliminating concentration can significantly speed up sample preparation, but sometimes lowering detection limits is of greater concern. Employing CSR-LVSI can be advantageous here as well, since it can be combined with extract concentration. This technique was used in addition to a larger sample volume for the Spring Creek water sample. The combination of a 4 L sample volume, concentration step, and 12.5 µL injection volume on a GC with a sensitive TOFMS, allowed the detection of sub part-per-trillion (ppt) to high part-per-quadrillion (ppq) levels of analytes (Table III).
Table III: Target compounds identified at ppt levels in the Spring Creek water sample.
| Compound | ng/L |
| Atrazine | 36 |
| Kepone | ND |
| BDE-47 | 0.67 |
| Mirex | 0.46 |
| BDE-100 | 1.1 |
| BDE-99 | 0.7 |
| ND = non-detect | |
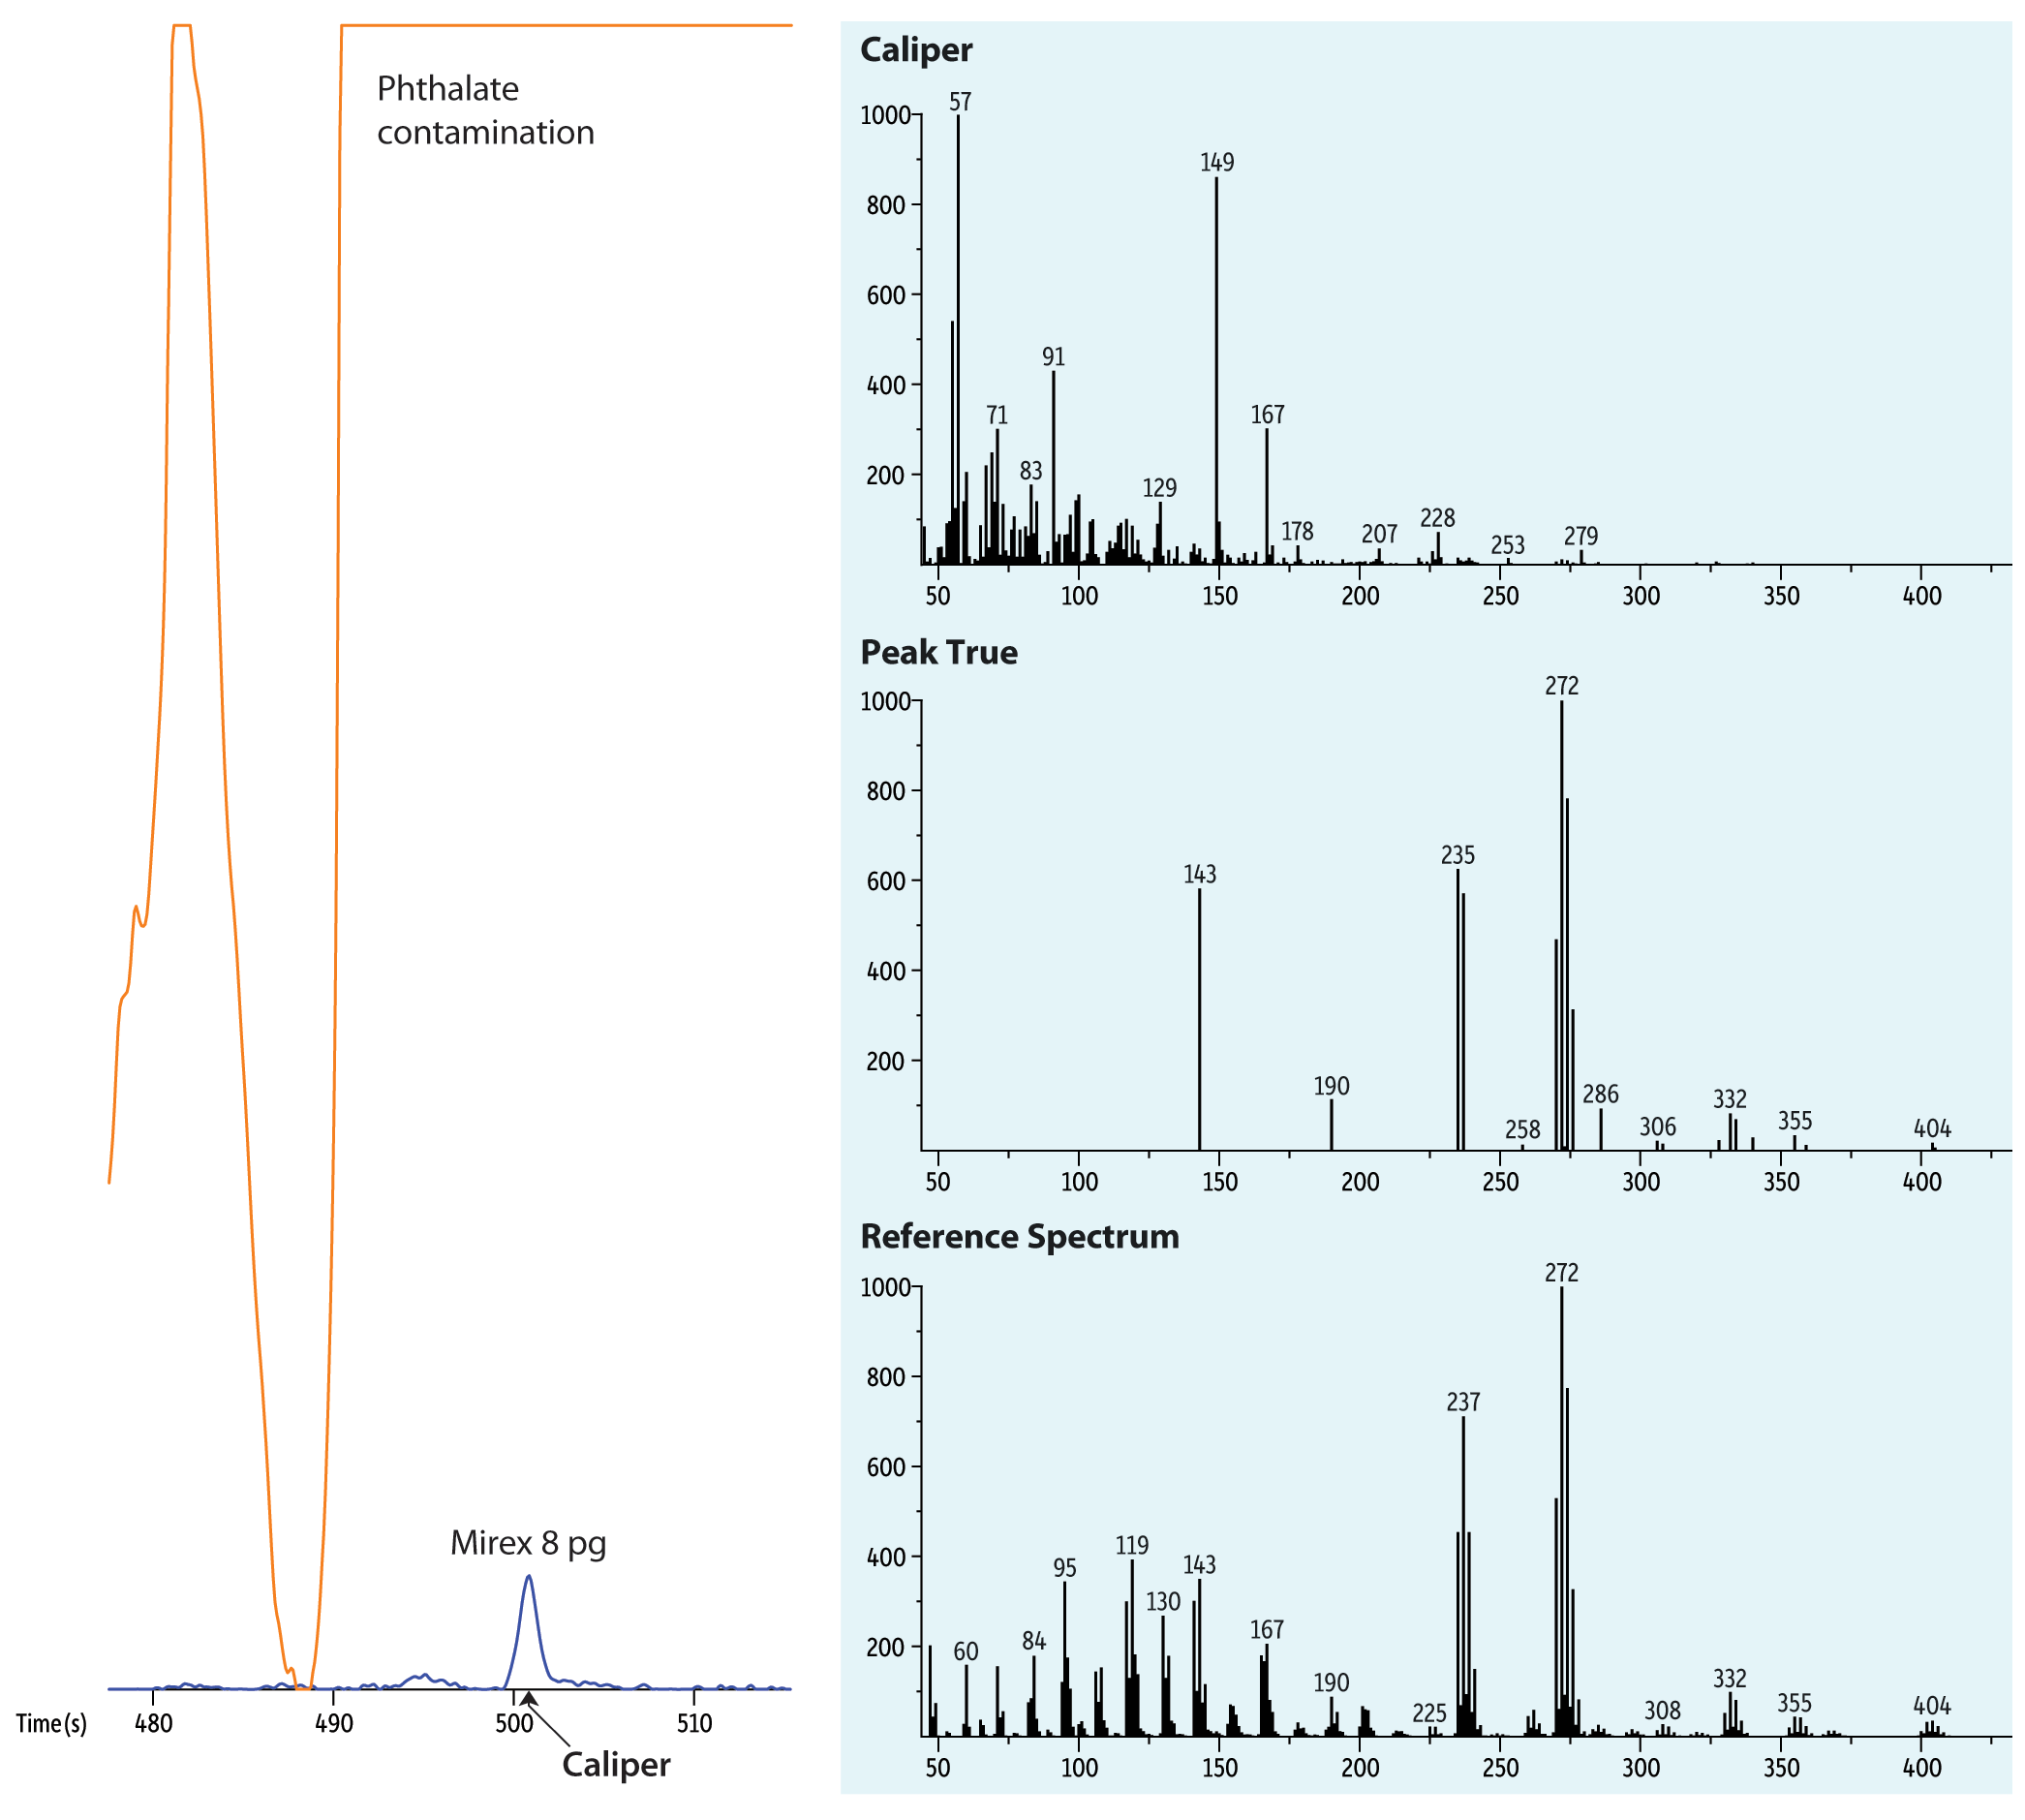
To ease the detection of low level target analytes, the ChromaTOF software (LECO Corporation, Saint Joseph, Michigan) coupled with the rapid data collection of the TOFMS allowed for spectral deconvolution of target analytes. The deconvolution provides a “peak true” spectrum that closely matches the reference spectrum of the key m/z ions even for an 8 pg Mirex peak that is heavily masked under a large m/z 149 peak due to a phthalate interference (Figure 3).
Figure 3: Comparison of caliper spectrum and peak true after spectral deconvolution in relation to reference spectrum of Mirex peak that is masked by phthalate contamination.
| Column | Rxi-5Sil MS, 15 m, 0.25 mm ID, 0.25 µm (cat.# 13620) |
|---|---|
| using IP Deactivated Guard Column 5 m, 0.53 mm ID (cat.# 10045) | |
| with Universal Press-Tight Connectors (cat.# 20429) | |
| Standard/Sample | Spring Creek water sample |
| Conc.: | 8 pg on-column |
| Injection | |
| Inj. Vol.: | 12.5 µL splitless (hold 0.583 min) |
| Liner: | Gooseneck Splitless (4mm) w/Semivolatiles Wool (cat.# 20799) |
| Inj. Temp.: | 250 °C |
| Purge Flow: | 40 mL/min |
| Oven | |
| Oven Temp.: | 40 °C (hold 0.60 min) to 320 °C at 30 °C/min (hold 1.07 min) |
| Carrier Gas | He, constant flow |
| Flow Rate: | 2 mL/min |
| Detector | MS |
|---|---|
| Mode: | |
| Transfer Line Temp.: | 290 °C |
| Analyzer Type: | TOF |
| Source Temp.: | 225 °C |
| Electron Energy: | -70 eV |
| Mass Defect: | -20 mu/100 u |
| Solvent Delay Time: | 3.33 min |
| Acquisition Range: | 45 - 750 amu |
| Spectral Acquisition Rate: | 10 spectra/sec |
| Instrument | LECO Pegasus 4D GCxGC-TOFMS |
| Notes | Carrier Gas Flow: 2 mL/min. corrected constant flow via pressure ramps |
Conclusions
Concurrent solvent recondensation–large volume splitless injection with an unmodified Agilent split/splitless GC inlet has been shown to be a technically viable approach with several potential advantages. We were able to eliminate the concentration step, saving over an hour of sample preparation time without compromising sensitivity. In addition, CSR-LVSI can be paired with extract concentration when extreme trace-level analysis is desired. As drinking water methods drive detection and quantitation limits lower, using CSR-LVSI can provide a cost-effective means to meet those requirements.