Meeting NJ Low Level TO-15 Air Testing Method Requirements

Abstract
The following study evaluated the efficacy of pairing a Markes Unity with CIA Advantage preconcentrator with a 30 m Rtx-VMS column to meet the criteria outlined for time-integrated, whole-air, canister samples in the New Jersey (NJ) Department of Environmental Protection (DEP) Site Remediation Program (SRP) Low Level (LL) U.S. EPA TO-15 Method. The majority of the method criteria closely follow the U.S. Environmental Protection Agency’s (EPA) Compendium Method TO-15 for toxic organic compounds (Determination of Volatile Organic Compounds [VOCs] in Air Collected in Specially-Prepared Canisters and Analyzed by Gas Chromatography–Mass Spectrometry [GC-MS]). Results demonstrate satisfactory chromatography, calibration relative response factors (RRFs) with an average relative standard deviation (RSD) of 14.8%, average scan method detection limits (MDLs) of 0.101 ppbv, average replicate precisions of 13.3% RSD, average audit accuracies of 7.6%, and acceptable carryover levels for all 75 target analytes evaluated. These performance levels met all NJ LL TO-15 Method guidelines and were achieved using a 30 m Rtx-VMS column.
Introduction
The Clean Air Act Amendments of 1990 require the U.S. Environmental Protection Agency (EPA) to control 189 hazardous air pollutants (HAPs). In accordance, the U.S. EPA has published a Compendium of Methods for the Determination of Toxic Organic (TO) Compounds in Ambient Air, Second Edition (EPA/625/R-96/010b, January 1999). More specifically, Compendium Method TO-15 (Determination of Volatile Organic Compounds [VOCs] in Air Collected in Specially-Prepared Canisters and Analyzed by Gas Chromatography–Mass Spectrometry [GC-MS]) has been developed for the sampling and analytical procedures for the measurement of a subset of 97 VOCs included in the 189 HAPs [1].
A comprehensive application note on how end users may utilize Restek products to meet the criteria outlined in Method TO-15 is available [2]. However, the state of New Jersey determined that Method TO-15 was insufficient to meet the demands of the Site Remediation Program (SRP). Therefore, the New Jersey (NJ) Department of Environmental Protection (DEP) published their own variant of Method TO-15, which is the New Jersey (NJ) Department of Environmental Protection (DEP) Site Remediation Program (SRP) Low Level (LL) U.S. EPA TO-15 Method [3]. For the most part, the NJ Low Level TO-15 air testing method follows the requirements of U.S. EPA Method TO-15 with the incorporation of the NJ DEP modifications listed below. The main goal of the NJ Low Level TO-15 method is to “provide for a lower reporting limit and additional quality control requirements.” The following is a list, as identified in the method, of what modifications have been made to the U.S. EPA TO-15 in the NJ Low Level TO-15 method.
- Holding times
- Canister types and regulators
- Method detection limits
- Reporting limits
- Clean canister certification levels
- GC-MS tuning and instrument performance check requirements
- GC-MS techniques
- Standard type and concentrations
- Initial and continuing calibration standards
- Laboratory control samples
- Limitation regarding the source of make-up air
Some of the aforementioned changes are straightforward/self-explanatory; therefore, they are outside the scope of this application note. Rather, this application note focuses on the analytical side of the method and the issues commonly reported by laboratories struggling to meet the NJ low level TO-15 air testing method requirements (e.g., calibrating from 0.2 ppbv to 40 ppbv).
Experimental
Analytical System
For all of the experiments, the following analytical system was utilized: a Markes Unity with CIA Advantage preconcentrator paired with an Agilent 7890B gas chromatograph (GC) coupled with an Agilent 5977A mass selective (MS) detector. The preconcentrator and GC-MS parameters may be found in Table I. The Markes Unity with canister interface accessory (CIA) Advantage utilizes one multi-sorbent trap, which is heated and cooled by a thermoelectric (i.e., Peltier) system. This arrangement allows for near instantaneous cooling and heating from -30 °C to 425 °C and, more important, does not require the use of liquid nitrogen. Similar to the well-known purge-and-trap systems, a split is utilized to remove water vapor, nitrogen, oxygen, and carbon dioxide prior to sample delivery to the GC-MS system. All samples were analyzed by preconcentrating 250 mL of sample with the addition of 5 mL of the TO-14A internal standard/tuning mix (cat.# 34408) (bromochloromethane, 1,4-difluorobenzene, chlorobenzene-d5, and 4-bromofluorobenzene) prepared at 500 ppbv concentrations.
Table I: Markes Unity with CIA Advantage and Agilent 7890B-5977A GC-MS Parameters (Default Preconcentration Volume = 250 mL)
| Markes CIA Advantage Parameters | Agilent 7890B/5977A GC-MS Parameters | ||
| General Settings | Column | ||
|
Mode |
MFC Sampling IS First |
Rtx-VMS, 30 m, 0.25 mm ID, 1.40 µm (cat.# 19915) |
|
|
Standby Split On |
True |
||
|
Standby Split Flow |
5 mL/min |
Oven |
|
|
Flow Path Temperature |
200 °C |
32 °C (hold 5 min) to 150 °C at 8 °C/min to 230 °C at 33 °C |
|
|
GC Cycle Time |
22.17 min |
|
|
|
Minimum Carrier Pressure |
5.0 psi |
Carrier Gas |
|
|
Type |
Helium |
||
|
Pre Sampling |
|
Mode |
Constant Flow |
|
Leak Test |
True |
Flow Rate |
2.0 mL/min |
|
Sample Purge Time |
1.0 min |
Linear Velocity |
51.15 cm/sec |
|
Sample Purge Flow |
50 mL/min |
||
|
Add Internal Standard |
True |
Detector |
|
|
Loop Fill Time |
1.0 min |
Type |
Single Quadrupole MS |
|
Loop Equilibrate Time |
0 min |
Mode |
Scan |
|
Loop Inject Time |
1.0 min |
Transfer Line Temp. |
250 °C |
|
Loop Inject Flow |
5 mL/min |
Source Temp. |
230 °C |
|
Quad Temp. |
150 °C |
||
|
Sampling |
Electron Energy |
70 eV |
|
|
Sample By Volume |
True |
Tune Type |
BFB |
|
Sample Quantity |
250 mL |
Ionization Mode |
EI |
|
Sample Flow |
100 mL/min |
|
|
|
Use Dedicated Purge Channel |
False |
|
|
|
Post Sampling Purge Time |
1.0 min |
|
|
|
Post Sampling Purge Flow |
50.0 mL/min |
|
|
|
Enable CIA Post Sampling Purge |
True |
|
|
|
Trap Settings |
|
||
|
Trap Purge |
1.0 min |
|
|
|
Trap Purge Flow |
50 mL/min |
|
|
|
Trap Low |
40 °C |
|
|
|
Trap High |
300 °C |
|
|
|
Trap Heating Rate |
Max |
|
|
|
Trap Hold |
3.0 min |
|
|
|
Split On |
True |
|
|
|
Split Flow |
7.5 mL/min |
|
|
|
Post Desorb Purge Time |
1.0 min |
|
|
|
Post Desorb Purge Flow |
100 mL/min |
|
|
Canister Cleaning/Blanks
NJ Low Level TO-15 air testing method blank requirements are identical to U.S. EPA TO-15 blank requirements (i.e., all target analytes less than 0.20 ppbv). Therefore, all canisters were cleaned and blanks were generated as detailed in application note EVAN1725B-UNV, which demonstrated acceptable blank cleaning practices [2].
Calibration Curve
A six-point calibration curve was generated by analyzing a series of canisters (Table II). The default preconcentration volume was 250 mL. Each canister standard was prepared from a 1.0 ppmv stock standard of 75-component TO-15 + NJ mix (cat.# 34396). More specifically, each working standard was generated by using a gas-tight syringe (e.g., cat.# 21275) to inject the volume listed in Table II into an evacuated six-liter SilcoCan air monitoring canister (cat.# 27411) and pressurizing the canister to 34 psig. All canister pressures were verified with an Ashcroft digital test gauge (cat.# 24268). All canisters were pressurized with 50% RH air, which was generated by bubbling the air through a humidification chamber (cat.# 24282). The standard was allowed to age for at least 24 hours, but was no older than 30 days at the time of use.
Table II: Calibration Curve
| Stock Standard Concentration (ppbv) | Injection Volume (mL) | Canister Pressure (psig) | Working Standard Concentration (ppbv) |
|---|---|---|---|
|
1,000 |
4 |
34 |
0.20 |
|
1,000 |
16 |
34 |
0.80 |
|
1,000 |
40 |
34 |
2.0 |
|
1,000 |
200 |
34 |
10 |
|
1,000 |
400 |
34 |
20 |
|
1,000 |
800 |
34 |
40 |
Method Detection Limits
Method detection limits (MDLs) were determined as prescribed in the Code of Federal Regulations (40 CFR 136, Appendix B). Specifically, MDLs were determined from seven replicate measurements of a low-level standard containing each compound of interest at concentrations near (within a factor of five) the expected detection limits. MDLs were calculated as the standard deviation of the seven replicate measurements multiplied by 3.14 (i.e., the Student's t-value for 99 percent confidence for seven values). MDLs were determined for the analytical system in full scan mode using a 0.20 ppbv standard.
Precision
Precision determinations were made from seven replicate measurements of a 0.20 ppbv standard. Precision for each analyte was calculated as the standard deviation of the seven replicate measurements divided by the average value of the seven replicate measurements and expressed as a percentage as follows:
σ = The standard deviation of an array
μ = The average of an array
Analytical Accuracy
Analytical accuracy for each compound was determined from the analysis of an audit standard prepared at 10.0 ppbv and 50% RH, which was representative of a continuing calibration verification (CCV) standard. Analytical accuracy was calculated as the difference between the nominal concentration of the audit standard and the measured value divided by the nominal concentration of the audit standard, expressed as a percentage as follows:
Carryover
Carryover was evaluated by analyzing a series of blanks and relatively high concentration samples. The following two carryover experiments were conducted to evaluate the carryover effect of a moderately high sample (experiment 1) and an inordinately high sample (experiment 2).
Experiment 1: Blank – 200 ppbv – Blank – 200 ppbv – Blank – 200 ppbv – Blank
Experiment 2: Blank – 1,000 ppbv – Blank – 1,000 ppbv – Blank – 1,000 ppbv – Blank
Carryover was calculated as the concentration in the subsequent blank divided by the concentration in the preceding sample, expressed as a percentage as follows:
Results and Discussion
Results from the calibration, MDL, precision, and accuracy experiments are shown in Table III and discussed relative to the specific method requirements below. It is important to note that the NJ LL TO-15 Method requires 61 compounds; however, the current study evaluated 75. Overall, excellent performance was obtained by the combination of the Markes Unity with CIA Advantage and the 30 m Rtx-VMS column.
Chromatography
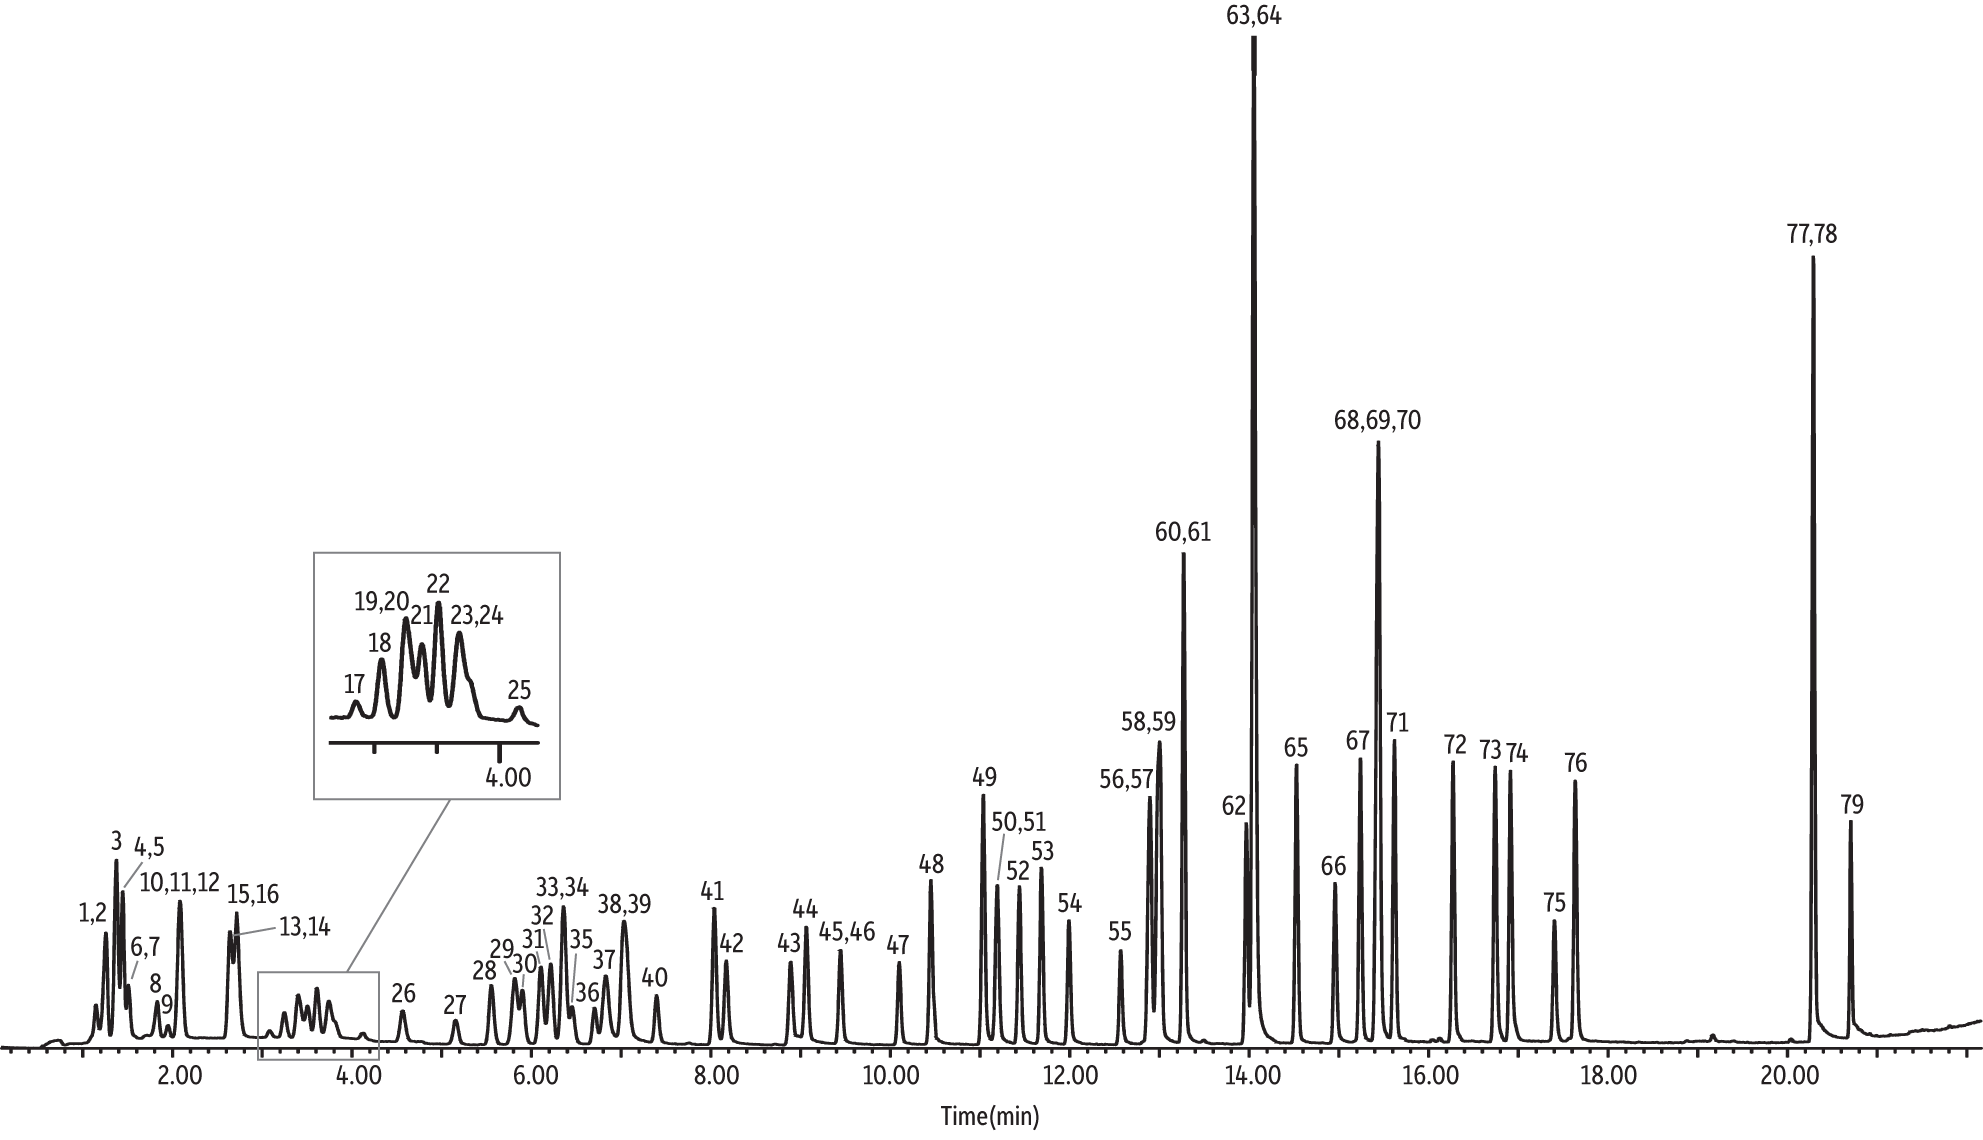
U.S. EPA Method TO-15 is applicable to 97 VOCs that are a subset of the 189 HAPs that are included in Title III of the Clean Air Act Amendments; however, only a few laboratories are analyzing all 97 components. Most laboratories are evaluating a standard suite of 65 VOCs for TO-15 (cat.# 34436). Some researchers add or remove a compound or two from the standard 65, but again the majority of laboratories are assessing approximately the same 65 analytes. The NJ Low Level TO-15 method clearly specifies 63 compounds (denoted in Table III), which means the following 10 extra VOCs (cat.# 34398) must be analyzed in addition to the standard 65: n-butane, tert-butyl alcohol, 3-chloroprene, 2-chlorotoluene, cumene, n-nonane, n-pentane, n-propylbenzene, 2,2,4-trimethylpentane, and vinyl bromide. However, it is important to note that Table 2 (pages 34–37) of the NJ Low Level TO-15 air testing method indicates, “ethanol and isopropyl alcohol are listed only because labs report data for these compounds, but dilutions are not required. If looking for these compounds, other methods may be required.” Based on the aforementioned, one may interpret that the NJ Low Level TO-15 method does not require ethanol and isopropyl alcohol and, therefore, is only applicable to 61 VOCs. Regardless, in order to keep things simple and cover all the analytes of interest, the following study evaluated 75 VOCs (cat.# 34396). Although separation of the standard suite of 65 VOCs has already been demonstrated in application note EVAN1725B-UNV [2], the additional 10 compounds (75 total) could pose a chromatographic challenge; however, by utilizing the parameters outlined in Table I, satisfactory separations are achieved (Figure 1).
Figure 1: Total ion chromatogram (TIC) of 75 NJ Low Level TO-15 air testing method compounds, including four internal standards (IS) on a 30 m Rtx-VMS column.
| Peaks | tR (min) | |
|---|---|---|
| 1. | Propylene | 1.21 |
| 2. | Dichlorodifluoromethane (Freon 12) | 1.25 |
| 3. | 1,2-Dichlorotetrafluoroethane (Freon 114) | 1.37 |
| 4. | Chloromethane | 1.43 |
| 5. | n-Butane | 1.45 |
| 6. | Vinyl chloride | 1.49 |
| 7. | 1,3-Butadiene | 1.51 |
| 8. | Bromomethane | 1.82 |
| 9. | Chloroethane | 1.94 |
| 10. | Vinyl bromide | 2.06 |
| 11. | n-Pentane | 2.08 |
| 12. | Trichlorofluoromethane (Freon 11) | 2.09 |
| 13. | Carbon disulfide | 2.64 |
| 14. | 1,1-Dichloroethene | 2.64 |
| 15. | 1,1,2-Trichlorotrifluoroethane (Freon 113) | 2.68 |
| 16. | Ethanol | 2.68 |
| 17. | Acrolein | 3.09 |
| 18. | Allyl chloride | 3.25 |
| 19. | Methylene chloride | 3.40 |
| 20. | Isopropyl alcohol | 3.45 |
| 21. | Acetone | 3.51 |
| 22. | trans-1,2-Dichloroethene | 3.62 |
| 23. | Hexane | 3.75 |
| 24. | Methyl tert-butyl ether (MTBE) | 3.82 |
| 25. | Tertiary butanol | 4.13 |
| 26. | 1,1-Dichloroethane | 4.58 |
| Peaks | tR (min) | |
|---|---|---|
| 27. | Vinyl acetate | 5.16 |
| 28. | cis-1,2-Dichloroethene | 5.56 |
| 29. | Cyclohexane | 5.83 |
| 30. | Bromochloromethane (IS) | 5.90 |
| 31. | Chloroform | 6.12 |
| 32. | Carbon tetrachloride | 6.22 |
| 33. | Tetrahydrofuran | 6.36 |
| 34. | 1,1,1-Trichloroethane | 6.37 |
| 35. | Ethyl acetate | 6.46 |
| 36. | 2-Butanone (MEK) | 6.70 |
| 37. | 2,2,4-Trimethylpentane | 6.84 |
| 38. | Benzene | 7.03 |
| 39. | Heptane | 7.07 |
| 40. | 1,2-Dichloroethane | 7.40 |
| 41. | Trichloroethylene | 8.05 |
| 42. | 1,4-Difluorobenzene (IS) | 8.18 |
| 43. | 1,2-Dichloropropane | 8.90 |
| 44. | Bromodichloromethane | 9.07 |
| 45. | 1,4-Dioxane | 9.44 |
| 46. | Methyl methacrylate | 9.45 |
| 47. | cis-1,3-Dichloropropene | 10.11 |
| 48. | Toluene | 10.46 |
| 49. | Tetrachloroethene | 11.05 |
| 50. | 4-Methyl-2-pentanone (MIBK) | 11.19 |
| 51. | trans-1,3-Dichloropropene | 11.21 |
| 52. | 1,1,2-Trichloroethane | 11.45 |
| Peaks | tR (min) | |
|---|---|---|
| 53. | Dibromochloromethane | 11.70 |
| 54. | 1,2-Dibromoethane | 12.01 |
| 55. | 2-Hexanone (MBK) | 12.58 |
| 56. | Chlorobenzene-d5 (IS) | 12.89 |
| 57. | Chlorobenzene | 12.91 |
| 58. | n-Nonane | 12.99 |
| 59. | Ethylbenzene | 13.02 |
| 60. | m-Xylene | 13.27 |
| 61. | p-Xylene | 13.27 |
| 62. | o-Xylene | 13.97 |
| 63. | Bromoform | 14.05 |
| 64. | Styrene | 14.07 |
| 65. | Cumene | 14.53 |
| 66. | 4-Bromofluorobenzene* | 14.96 |
| 67. | n-Propylbenzene | 15.24 |
| 68. | 1,1,2,2-Tetrachloroethane | 15.42 |
| 69. | 2-Chlorotoluene | 15.44 |
| 70. | 4-Ethyltoluene | 15.45 |
| 71. | 1,3,5-Trimethylbenzene | 15.62 |
| 72. | 1,2,4-Trimethylbenzene | 16.28 |
| 73. | 1,3-Dichlorobenzene | 16.74 |
| 74. | 1,4-Dichlorobenzene | 16.92 |
| 75. | Benzyl chloride | 17.41 |
| 76. | 1,2-Dichlorobenzene | 17.64 |
| 77. | 1,2,4-Trichlorobenzene | 20.28 |
| 78. | Hexachlorobutadiene | 20.29 |
| 79. | Naphthalene | 20.72 |
| Column | Rtx-VMS, 30 m, 0.25 mm ID, 1.40 µm (cat.# 19915) |
|---|---|
| with MXT low-dead-volume connector kit (cat.# 20536) | |
| Standard/Sample | TO-14A internal standard/tuning mix (cat.# 34408) |
| 75 comp TO15 + NJ mix (cat.# 34396) | |
| Diluent: | Nitrogen |
| Conc.: | 10.0 ppbv 250 mL injection |
| Injection | on-column |
| Oven | |
| Oven Temp.: | 32 °C (hold 5 min) to 150 °C at 8 °C/min to 230 °C at 33 °C/min |
| Carrier Gas | He, constant flow |
| Flow Rate: | 2.0 mL/min |
| Linear Velocity: | 51.15 cm/sec @ 35 °C |
| Detector | MS | ||||||||
|---|---|---|---|---|---|---|---|---|---|
| Mode: | Scan | ||||||||
| Scan Program: | |||||||||
| |||||||||
| Transfer Line Temp.: | 250 °C | ||||||||
| Analyzer Type: | Quadrupole | ||||||||
| Source Type: | Extractor | ||||||||
| Extractor Lens: | 6 mm ID | ||||||||
| Source Temp.: | 230 °C | ||||||||
| Quad Temp.: | 150 °C | ||||||||
| Electron Energy: | 70.0 eV | ||||||||
| Tune Type: | BFB | ||||||||
| Ionization Mode: | EI | ||||||||
| Instrument | Agilent 7890B GC & 5977A MSD | ||||||||
As shown in the Figure 1 total ion chromatogram (TIC), the 79 VOCs (i.e., 75 target analytes and four internal standards) were separated well in a 22-minute GC analysis. Only one critical coelution was found: chloromethane and n-butane. Chloromethane’s quantitation ion (50 m/z) is a minor ion for butane. Analysts can watch for this coelution during real-world sample analyses by monitoring for butane’s quantitation ion (43 m/z). In addition, in an effort to quantify the bias butane contributes to chloromethane, a calibration curve was prepared as outlined in the Experimental section (Table II). Both chloromethane and butane were present in the calibration standards. Then, a 10-ppbv audit sample that did not contain butane was analyzed over seven replicate injections. The average chloromethane concentration was 8.01 ppbv, which is ~20% different from the audit concentration (note that this was a separate experiment from the accuracy results presented in Table III), but well within the accuracy requirements of ±30% for the NJ Low Level TO-15 method.
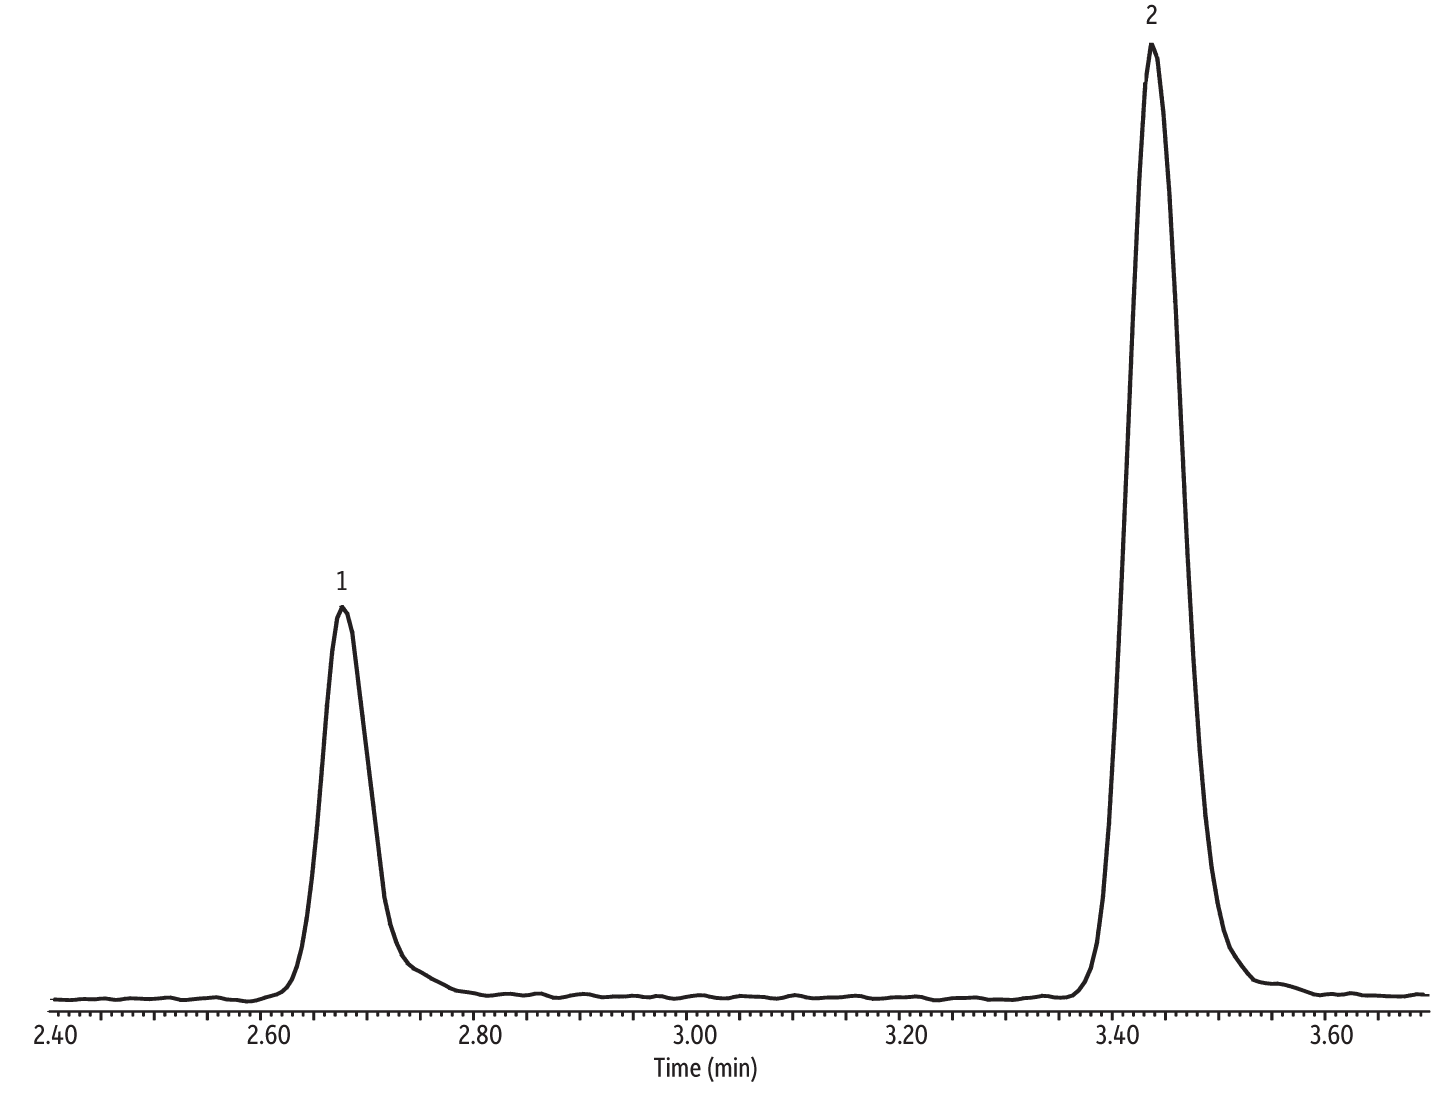
The focus of this study was evaluating the efficacy of the Markes Unity with CIA Advantage paired with a 30 m Rtx-VMS column in meeting the requirements of the NJ Low Level TO-15 air testing method; therefore, optimizing the chromatography was not a priority. Consequently, the GC oven program was based on speed-optimized flow (SOF) and optimal heating rate (OHR) [4]. Despite the simple oven program leaving plenty of room for optimization, the chromatography provided by the Markes Unity with CIA Advantage and the 30 m Rtx-VMS column (cat.# 19915) is still very good. For example, ethanol and isopropyl alcohol (IPA) are polar compounds, which often present chromatographic challenges for preconcentrators and GC columns. However, as shown in the extracted ion chromatogram (EIC) in Figure 2, excellent peak shape with no sign of tailing was obtained for both ethanol and IPA.
Figure 2: Good peak shape was obtained for challenging polar compounds using the Markes Unity with CIA Advantage and a 30 m Rtx-VMS column with (extracted ion chromatogram of ion 45 (m/z).
| Peaks | tR (min) | |
|---|---|---|
| 1. | Ethanol | 2.68 |
| 2. | Isopropyl alcohol | 3.45 |
| Column | Rtx-VMS, 30 m, 0.25 mm ID, 1.40 µm (cat.# 19915) |
|---|---|
| with MXT low-dead-volume connector kit (cat.# 20536) | |
| Standard/Sample | TO-14A internal standard/tuning mix (cat.# 34408) |
| 75 comp TO15 + NJ mix (cat.# 34396) | |
| Diluent: | Nitrogen |
| Conc.: | 10.0 ppbv 250 mL injection |
| Injection | on-column |
| Oven | |
| Oven Temp.: | 32 °C (hold 5 min) to 150 °C at 8 °C/min to 230 °C at 33 °C/min |
| Carrier Gas | He, constant flow |
| Flow Rate: | 2.0 mL/min |
| Linear Velocity: | 51.15 cm/sec @ 35 °C |
| Detector | MS | ||||||||
|---|---|---|---|---|---|---|---|---|---|
| Mode: | Scan | ||||||||
| Scan Program: | |||||||||
| |||||||||
| Transfer Line Temp.: | 250 °C | ||||||||
| Analyzer Type: | Quadrupole | ||||||||
| Source Type: | Extractor | ||||||||
| Extractor Lens: | 6 mm ID | ||||||||
| Source Temp.: | 230 °C | ||||||||
| Quad Temp.: | 150 °C | ||||||||
| Electron Energy: | 70.0 eV | ||||||||
| Tune Type: | BFB | ||||||||
| Ionization Mode: | EI | ||||||||
| Instrument | Agilent 7890B GC & 5977A MSD | ||||||||
Internal Standards
The NJ Low Level TO-15 method stipulates that internal standards (IS) must accompany each sample run at a concentration of 10 ppbv. Since the calibration is based on a relative response factor (RRF), which is dependent on the performance of the IS, it is a prerequisite to have low relative standard deviations (RSDs) on the IS injections. It is outside the scope of this application note to show all of the optimization experiments conducted in order to optimize method parameters such as the “pre sampling loop fill time”; however, the parameters outlined in Table I worked best on the current system. It is important to note that no two preconcentration systems are identical and they all have slightly different optimized parameters; however, the parameters in Table I represent an excellent starting point.
Markes delivered the current Unity with CIA Advantage with a 1.0 mL sampling loop, which is responsible for delivering the IS to the Unity’s trap. In order to obtain the best IS RSDs and consequently achieve the desired RSDs on the calibration RRFs, the 1.0 mL sampling loop was replaced with a 5.0 mL sampling loop (cat.# 22850). This modification accomplished the following:
- With the default injection volume of 250 mL (to be discussed in the calibration section), one would have to inject 2.5 ppmv of IS on the 1.0 mL sampling loop in order to attain the required 10 ppbv concentration. This would require a custom IS mix, as most standards are offered at 1.0 ppmv. The 5.0 mL sampling loop avoids the costs and delays associated with acquiring custom IS.
- It is preferential to take a 1.0 ppmv IS mix and dilute it in a 6 L canister down to 500 ppbv, which gives 10 ppbv on a 5.0 mL sampling loop. This helps to ensure that a leak will not result in the loss of an entire bottle of expensive IS.
- The use of diluted IS in a 6 L canister allows for the use of a regulator (cat.# 27215) to run the IS at 4 psig. It is outside the scope of this application note to explain why the pressure matters; however, in short, the sample loop cannot be under pressure at the time of injection (unless the pressure is extremely consistent, which is difficult to attain). Therefore, using a regulator to maintain the IS pressure at 4 psig is preferred.
- As with any analytical instrument, some variability exists. For example, a ±10 µL difference from injection to injection on a 1.0 mL sample loop (remembering that the pressure plays a role in this) would represent 1.0 % in run-to-run variability. However, the same 10-µL fluctuation on a 5.0 mL sample loop would only represent 0.2% variability. So the 5.0 mL sample loop minimizes the RSDs across IS injections.
Calibration Curve
The NJ Low Level TO-15 air testing method requires that the preconcentrator–GC-MS system be calibrated with a minimum of five points (more allowed) and that the range must be from 0.2 to 40 ppbv for the majority of compounds (exceptions to be discussed later). Having to span greater than two orders of magnitude with a preconcentrator–GC-MS system represents the single biggest hurdle in the NJ Low Level TO-15 method. An informal customer survey of laboratories attempting NJ LL TO-15 confirmed that the calibration criterion is the biggest challenge, especially for all 75 compounds. It is a fine balancing act between injection volume, breakthrough volume, detection limits, saturation limits, etc. However, the aim of this application note is to eliminate these obstacles.
Of the possible variables that can affect the calibration curves, injection volume was found to be almost as important as the IS injection precision. The current system had an ideal injection volume around 250 mL. This volume was largely dictated by chloromethane because it would start to break through at larger injection volumes. Had it not been for chloromethane, larger injection volumes would have been suitable. Regardless, 250 mL provides sufficient mass to the detector to have legitimate peaks at 0.2 ppbv, meaning peak signal-to-noise ratios were 10:1 or better at this concentration. This was achieved on a dirty source, which was used in order to represent a real-world scenario. Utilizing the IS parameters outlined here and a 250 mL sample volume of 0.2, 0.8, 2.0, 10, 20, and 40 ppbv of the target analytes, the calibrations curves shown in Table III, were easily achieved. It is important to note that 250 mL was injected at each calibration point, as opposed to injecting different volumes of the same calibration standard.
NJ Low Level TO-15 air testing method stipulates that the calculated RSD for RRF for each compound in the calibration must be less than 30%, with at most two exceptions up to a limit of 40%. As shown in the Table III, the %RSD for the average RRF was 14.8%. The only two compounds that do not meet the method criteria are ethanol and acetone. However, NJ LL TO-15 provides an exception that the lowest calibration point may be higher than 0.2 ppbv; however, the upper limit of 40 ppbv remains the same. This exception is applicable to the following list of compounds: acetone, chloroethane, chloromethane, carbon disulfide, dichlorodifluoromethane, 1,4-dioxane , ethanol, isopropanol, methylene chloride, methyl ethyl ketone, methyl methacrylate, tertiary butyl alcohol, tetrahydrofuran, and 1,2,4-trimethylbenzene. The authors of NJ Low Level TO-15 method realized that these compounds could present a challenge. In particular, ethanol and acetone are difficult at the lower calibration levels due to background contamination. If the two lowest calibration points are removed for both of these compounds due to blank cleanliness, then the %RSDs become 7.41% and 6.31% for ethanol and acetone, respectively.
Method Detection Limits
The NJ Low Level TO-15 air testing method identified MDLs as being one of the items modified from U.S. EPA Method TO-15. However, the only modification is that NJ LL TO-15 has outlined “specific criteria that the laboratory must meet regarding the Method Detection Limit (MDL)" and “An MDL study must be conducted annually.” Other than that, NJ LL TO-15 actually states that “the laboratory shall calculate all Method Detection Limits (MDLs), in accordance Method TO-15. Section 11.2 of US EPA Method TO-15 requires the use of the procedures stated in Appendix B of 40 CFR 136 for performing the MDL study.” This means that laboratories shall continue as is normally done for U.S. EPA Method TO-15; however, with the stipulation that they conduct the MDL determination using a spiking solution at 0.20 ppbv, and that the derived MDL must be less than the clean canister certification level of 0.20 ppbv. NJ Low Level TO-15 method does allow for some compounds to be spiked at higher concentrations. Using the parameters outlined above, seven injections of a 0.20 ppbv standard resulted in average scan method detection limits (MDLs) of 0.101 ppbv and all but two of the 75 compounds had an MDL less than 0.20 ppbv (Table III). Acetone and tertiary butyl alcohol (TBA) were marginally above 0.20 ppbv. Again, the authors of the NJ Low Level TO-15 method accounted for this and provide leeway by setting higher MDLs for acetone (1.00 ppbv) and TBA (3.00 ppbv). The aforementioned results were all achieved in full scan mode, with only a 250 mL injection, with a dirty source, and without manual integrations (except for gross errors), meaning they are realistic representations of real-world samples.
Precision
The NJ Low Level TO-15 method follows the exact same precision guidelines set forth in U.S. EPA Method TO-15. The precision experiment data (Table III) demonstrate that the Markes Unity with CIA Advantage and a 30 m Rtx-VMS column easily meet the NJ Low Level TO-15 method requirement (i.e., replicate precision within 25%) for all 75 target analytes. The average precision is 13.3 %RSD.
Accuracy
Results from the analytical accuracy experiment shown in Table III demonstrate the Markes Unity with CIA Advantage and a 30 m Rtx-VMS column meet the NJ Low Level TO-15 method requirement (i.e., audit accuracy within 30%) for all 75 target analytes, except for ethanol. The failing result for ethanol is directly related to the canister blank concentration and resulting poor calibration curve. However, if the two lowest calibration points are removed for ethanol due to blank cleanliness, then the accuracy becomes 27.7% for ethanol. The average analytical accuracy is 7.60%.
Carryover
The Markes Unity with CIA Advantage contains a proprietary triple-sorbent trap. Although the trap is a trade secret, it is clear that it contains a carbon sorbent. Carbon sorbents are so strong that they represent a concern for sample carryover. Results from the carryover evaluation demonstrate an average carryover of 0.03 and 0.17% for experiments 1 and 2, respectively. Note that these same carryovers correspond to 0.03 and 1.14 ppbv in the carryover runs for experiments 1 and 2, respectively. Results from carryover experiment 1 indicate that routine samples do not result in carryover of any concern. Concern was defined as any concentration close to the blank cleanliness level (0.20 ppbv) by NJ LL TO-15. However, results from carryover experiment 2 suggest that when analyzing high concentration samples, they should be run at the end of the sequence and with blanks/conditioning runs in between sample injections.
Table III: Results from calibration, MDL, precision, and accuracy experiments demonstrate the NJ Low Level TO-15 method criteria were met by the Markes Unity with CIA Advantage and 30 m Rtx-VMS analytical column.
|
Compound |
Calibration |
MDL (ppbv)2 |
Precision (%RSD)3 |
Audit Accuracy (%)4 |
NJ LL |
|---|---|---|---|---|---|
|
Propylene |
5.04 |
0.118 |
10.9 |
7.80 |
|
|
Dichlorodifluoromethane (Freon 12) |
11.1 |
0.099 |
12.9 |
5.00 |
x |
|
1,2-Dichlorotetrafluoroethane (Freon 114) |
9.18 |
0.067 |
9.52 |
6.70 |
x
|
|
Chloromethane |
15.1 |
0.136 |
14.9 |
7.90 |
x |
|
n-Butane |
13.8 |
0.132 |
13.8 |
-4.30 |
|
|
Vinyl chloride |
11.7 |
0.120 |
13.4 |
5.10 |
x |
|
1,3-Butadiene |
11.2 |
0.195 |
21.6 |
0.20 |
x |
|
Bromomethane |
10.2 |
0.143 |
18.2 |
6.50 |
x |
|
Chloroethane |
25.6 |
0.110 |
12.1 |
6.60 |
x |
|
Vinyl bromide |
10.0 |
0.077 |
11.3 |
6.90 |
x |
|
n-Pentane |
14.3 |
0.147 |
14.1 |
12.9 |
|
|
Trichlorofluoromethane (Freon 11) |
11.9 |
0.081 |
11.2 |
7.20 |
x |
|
Carbon disulfide |
13.8 |
0.139 |
13.3 |
11.7 |
x |
|
1,1-Dichloroethene |
14.3 |
0.085 |
12.0 |
9.60 |
x |
|
1,1,2-Trichlorotrifluoroethane (Freon 113) |
16.3 |
0.073 |
10.7 |
11.0 |
x |
|
Ethanol* |
104 |
0.185 |
8.84 |
92.1 |
|
|
Acrolein |
14.9 |
0.120 |
11.4 |
10.0 |
|
|
Allyl chloride |
13.6 |
0.125 |
13.6 |
24.9 |
x |
|
Methylene chloride |
18.0 |
0.191 |
15.0 |
6.90 |
x |
|
Isopropyl alcohol* |
19.7 |
0.192 |
15.8 |
4.10 |
|
|
Acetone |
71.3 |
0.320 |
15.4 |
20.6 |
x |
|
trans-1,2-Dichloroethene |
9.83 |
0.112 |
14.8 |
9.70 |
x |
|
Hexane |
11.9 |
0.174 |
22.2 |
-2.50 |
x |
|
Methyl tert-butyl ether (MTBE) |
11.6 |
0.122 |
20.4 |
18.9 |
x |
|
Tertiary butanol |
29.2 |
0.226 |
24.9 |
13.9 |
x |
|
1,1-Dichloroethane |
4.72 |
0.127 |
14.2 |
9.80 |
x |
|
Vinyl acetate |
13.7 |
0.162 |
21.1 |
24.6 |
|
|
cis-1,2-Dichloroethene |
11.9 |
0.095 |
14.3 |
8.50 |
x |
|
Cyclohexane |
11.2 |
0.116 |
19.0 |
27.9 |
x |
|
Bromochloromethane |
NA |
NA |
NA |
NA |
IS |
|
Chloroform |
6.68 |
0.067 |
9.17 |
12.2 |
x |
|
Carbon tetrachloride |
13.9 |
0.080 |
13.3 |
9.90 |
x |
|
1,1,1-Trichloroethane |
11.1 |
0.061 |
8.93 |
16.3 |
x |
|
Tetrahydrofuran |
13.1 |
0.144 |
18.5 |
7.00 |
x |
|
Ethyl acetate |
11.8 |
0.122 |
13.5 |
17.2 |
|
|
2-Butanone (MEK) |
11.1 |
0.081 |
7.38 |
13.5 |
x |
|
2,2,4-Trimethylpentane |
18.3 |
0.074 |
12.9 |
13.2 |
x |
|
Benzene |
22.5 |
0.057 |
8.07 |
14.3 |
x |
|
Heptane |
15.4 |
0.072 |
12.5 |
3.50 |
x |
|
1,2-Dichloroethane |
11.0 |
0.078 |
10.0 |
8.40 |
x |
|
Trichloroethylene |
8.18 |
0.062 |
11.4 |
23.4 |
x |
|
1,4-Difluorobenzene |
NA |
NA |
NA |
NA |
IS |
|
1,2-Dichloropropane |
13.2 |
0.117 |
12.5 |
4.40 |
x |
|
Bromodichloromethane |
13.6 |
0.121 |
14.6 |
-4.90 |
x |
|
Methyl methacrylate |
18.1 |
0.084 |
10.2 |
-5.60 |
x |
|
1,4-Dioxane |
22.3 |
0.110 |
17.2 |
-6.90 |
x |
|
cis-1,3-Dichloropropene |
8.83 |
0.074 |
11.5 |
9.60 |
x |
|
Toluene |
4.75 |
0.080 |
11.1 |
18.0 |
x |
|
Tetrachloroethene |
9.55 |
0.062 |
12.6 |
20.1 |
x |
|
trans-1,3-Dichloropropene |
15.4 |
0.147 |
24.7 |
9.80 |
x |
|
4-Methyl-2-2pentanone (MIBK) |
9.21 |
0.107 |
11.9 |
14.1 |
x |
|
1,1,2-Trichloroethane |
11.7 |
0.105 |
13.0 |
9.30 |
x |
|
Dibromochloromethane |
14.6 |
0.078 |
12.3 |
7.40 |
x |
|
1,2-Dibromoethane |
12.2 |
0.079 |
12.2 |
7.40 |
x |
|
2-Hexanone (MBK) |
6.44 |
0.120 |
11.6 |
3.70 |
|
|
Chlorobenzene |
13.1 |
0.078 |
14.4 |
0.00 |
x |
|
Chlorobenzene-d5 |
NA |
NA |
NA |
NA |
IS |
|
n-Nonane |
16.3 |
0.100 |
12.0 |
0.80 |
|
|
Ethylbenzene |
15.4 |
0.060 |
13.2 |
4.40 |
x |
|
m- & p-Xylene |
14.2 |
0.039 |
8.77 |
1.50 |
x |
|
o-Xylene |
15.3 |
0.057 |
12.4 |
-1.20 |
x |
|
Bromoform |
20.2 |
0.030 |
9.25 |
-1.50 |
x |
|
Styrene |
22.5 |
0.050 |
10.9 |
11.2 |
x |
|
Cumene |
14.1 |
0.086 |
4.25 |
-1.80 |
|
|
4-Bromofluorobenzene |
NA |
NA |
NA |
NA |
Tuning |
|
n-Propyl benzene |
12.3 |
0.057 |
10.7 |
-11.3 |
|
|
2-Chlorotoluene |
14.7 |
0.124 |
14.9 |
-4.60 |
x |
|
1,1,2,2-Tetrachloroethane |
11.0 |
0.059 |
14.5 |
2.00 |
x |
|
4-Ethyltoluene |
15.7 |
0.057 |
14.6 |
0.20 |
x |
|
1,3,5-Trimethylbenzene |
16.7 |
0.038 |
9.45 |
2.10 |
x |
|
1,2,4-Trimethylbenzene |
18.0 |
0.034 |
8.31 |
2.60 |
x |
|
1,3-Dichlorobenzene |
10.8 |
0.050 |
12.6 |
4.50 |
x |
|
1,4-Dichlorobenzene |
13.4 |
0.105 |
21.1 |
5.60 |
x |
|
Benzyl chloride |
22.5 |
0.040 |
9.38 |
-20.8 |
|
|
1,2-Dichlorobenzene |
12.3 |
0.078 |
13.3 |
6.60 |
x |
|
1,2,4-Trichlorobenzene |
18.1 |
0.060 |
9.79 |
23.9 |
x |
|
Hexachlorobutadiene |
19.5 |
0.072 |
12.9 |
22.1 |
x |
|
Naphthalene |
28.8 |
0.101 |
13.4 |
7.50 |
|
|
Average |
14.8 |
0.101 |
13.3 |
7.60 |
|
1 Six-point calibration curve in scan mode.
2 Calculated as the standard deviation of seven replicate analyses of a 0.20 ppbv standard and the Student's t-test value for 99% confidence.
3 The %RSD obtained from seven replicate analyses of a 0.20 ppbv standard in scan mode.
4 Determined from a 10.0 ppbv audit standard.
* Listed in NJ LL TO-15, but not required. Ethanol omitted from averages.
Conclusions
This investigation was conducted to evaluate the efficacy of pairing Restek products with the Markes Unity with CIA Advantage to meet the most critical analytical requirements of the NJ Low Level TO-15 air testing method. Results demonstrate that the combination of the Markes Unity with CIA Advantage and a 30 m Rtx-VMS column affords end users the ability to conduct the NJ Low Level TO-15 method. It is important to note that all of the aforementioned results were obtained on a “close to real world” analytical system (i.e., although the instrument was tuned, the source had not just been freshly cleaned). Furthermore, except for instances in of gross error (very infrequent), all chromatographic peaks were auto-integrated (i.e., the peaks were not manually adjusted).
Acknowledgments
Markes
References
- U.S. Environmental Protection Agency, Compendium Method TO-15, Determination of volatile organic compounds [VOCs] in air collected in specially-prepared canisters and analyzed by gas chromatography/mass spectrometry (GC/MS), January 1999. http://www3.epa.gov/ttnamti1/files/ambient/airtox/to-15r.pdf
- J.S. Herrington, Rapid determination of TO-15 volatile organic compounds (VOCs) in air, Application note, EVAN1725A-UNV, Restek Corporation, 2016. https://www.restek.com/articles/rapid-determination-of-TO-15-volatile-organic-compounds-VOCs-in-air/
- New Jersey (NJ) Department of Environmental Protection (DEP), Site Remediation Program (SRP), NJDEP-SRWM Low Level USEPA Method TO-15, March 2007. http://www.nj.gov/dep/srp/guidance/vaporintrusion/newmethod2007/
- M.S Klee, L.M. Blumberg, Theoretical and practical aspects of fast gas chromatography and method translation, J. Chromatogr. Sci., 40 (5) (2002) 234-47. https://www.ncbi.nlm.nih.gov/pubmed/12049153