Analysis of Nitrosamine Impurities in Drugs by GC-MS/MS

Abstract
Testing APIs and drug products for nitrosamine impurities requires reliable separation of target analytes and detection limits in the low ppb range. In method developed here, Pro EZGC modeling software was used to quickly identify a recommended column and conditions prior to beginning lab work. Subsequent testing in the laboratory demonstrated that the method provided good resolution and low detection limits in run times of less than 10 minutes.
Introduction
Recently, several “sartan” class drugs have been found to contain nitrosamines, which can be carcinogenic at low levels. This has led to the FDA to require testing of active pharmaceutical ingredients (APIs) and drug products when there is a risk of nitrosamine formation. The FDA has released example methods for both LC and GC for a variety of these nitrosamines, requiring detection limits in the low ppb range [1]. For GC, analysis of nitrosamine impurities can be carried out using either headspace sample introduction for a few of the more volatile nitrosamines, or direct liquid injection, which is effective over a wider volatility range. While direct injection may be preferred due to its simplicity over headspace, it also introduces more matrix into the system. Because of the low levels of detection required, combined with the potential for matrix interferences, most methods recommend using GC with triple quadruple mass spectrometric detection (GC-MS/MS).
In this work, we used the Pro EZGC chromatogram modeler to first identify an analytical column and conditions for the optimized separation of the nitrosamines in Table I. Method performance was then confirmed in the laboratory and resulted in good linearity (R2>0.996) and low ppb level LODs (below 3 ppb) for all analytes, except for N-nitroso-N-methyl-4-aminobutyric acid (NMBA) and N-nitrosodiethanolamine (NDELA).
Table I: Target Compounds for the Analysis of Nitrosamine Impurities in Drugs
|
Compound |
Abbreviation |
CAS# |
|
N-Nitrosodimethylamine |
NDMA |
62-75-9 |
|
N-Nitrosodimethylamine-d6 (IS) |
NDMA-d6 |
17829-05-9 |
|
N-Nitrosomethylethylamine |
NMEA |
61445-55-4 |
|
N-Nitrosodiethylamine |
NDEA |
55-18-5 |
|
N-Nitrosoethylisopropylamine |
NEIPA |
16339-04-1 |
|
N-Nitroso-diisopropylamine |
NDIPA |
601-77-4 |
|
N-Nitroso-methylphenylamine |
NMPA |
614-00-6 |
|
N-Nitroso-di-n-propylamine |
NDPA |
10595-95-6 |
|
N-Nitrosomorpholine |
NMOR |
621-64-7 |
|
N-Nitrosopyrrolidine |
NPYR |
59-89-2 |
|
N-Nitrosopiperidine |
NPIP |
930-55-2 |
|
N-Nitroso-di-n-butylamine |
NDBA |
62-75-9 |
|
N-Nitroso-N-methyl-4-aminobutyric acid |
NMBA |
61445-55-4 |
|
N-Nitrosodiphenylamine |
NDPHA |
100-75-4 |
|
N-Nitrosodiethanolamine |
NDELA |
86-30-6 |
Experimental
Standard Preparation
A mixed nitrosamines calibration standard (1000 ppm) prepared in dichloromethane was further diluted in methanol to make the working standard solutions. Seven-point calibration curves covered a range of 1.25–120 ppb for most analytes and 3.8–365 ppb for NMBA, which had much lower response than the other compounds. The response for N-Nitrosodiethanolamine (NDELA) was so minimal that this compound was not tested further.
Chromatographic Method
Pro EZGC chromatogram modeling software was used to select an analytical column and identify method parameters that would optimize the nitrosamine separations prior to performing lab work. The final chromatographic conditions generated by the Pro EZGC software are presented in Figure 1. Additional parameters used during confirmation testing in the laboratory are given in Figure 2 and Table II. Use of the chromatogram modeling software greatly reduced method development time in the lab.
Table II: Ion Transitions
| Compound | Ret. Time (min) | Quantifier Ion | Qualifier Ion 1 | Qualifier Ion 2 | ||||||
|
Precurs. Mass |
Product Mass |
Collision Energy |
Precurs. Mass |
Product Mass |
Collision Energy |
Precurs. Mass |
Product Mass |
Collision Energy |
||
|
NDMA |
4.48 |
74 |
42 |
18 |
74 |
43 |
12 |
74 |
44 |
6 |
|
NDMA-d6 |
4.48 |
80 |
46 |
15 |
80 |
48 |
10 |
80 |
50 |
5 |
|
NMEA |
5.08 |
88 |
42 |
16 |
88 |
43 |
8 |
88 |
73 |
6 |
|
NDEA |
5.56 |
102 |
44 |
12 |
102 |
56 |
14 |
102 |
85 |
6 |
|
NEIPA |
5.96 |
116 |
44 |
12 |
116 |
99 |
6 |
56 |
41 |
20 |
|
NDIPA |
6.31 |
130 |
71 |
12 |
130 |
88 |
6 |
70 |
42 |
12 |
|
Methylaniline* |
6.53 |
107 |
77 |
26 |
106 |
77 |
14 |
106 |
51 |
28 |
|
NDPA |
6.62 |
130 |
85 |
8 |
130 |
113 |
6 |
70 |
43 |
6 |
|
NMOR |
6.71 |
116 |
56 |
10 |
116 |
86 |
6 |
56 |
51 |
16 |
|
NPYR |
6.79 |
100 |
55 |
6 |
100 |
68 |
8 |
100 |
70 |
6 |
|
NPIP |
7.02 |
114 |
69 |
6 |
114 |
84 |
8 |
114 |
97 |
6 |
|
NDBA |
7.65 |
158 |
99 |
8 |
116 |
99 |
6 |
84 |
56 |
14 |
|
Phenylbenzen-amine* |
9.36 |
169 |
66 |
22 |
168 |
139 |
36 |
169 |
168 |
12 |
*Methylaniline is the product of thermal degradation of N-nitroso-methylphenylamine (NMPA), and phenylbenzenamine is the product of N-nitrosodiphenylamine (NDPHA).
Results and Discussion
Chromatographic Performance
Using Pro EZGC chromatogram modeling software, we easily found an optimized column and condition recommendations (Figure 1). Applying the modelled parameters in the laboratory, we confirmed that excellent separations were generated on an Rxi-624Sil MS column in a very short run time (less than 10 minutes). Figure 2 shows the chromatographic separation for one of the calibration standards (120 ppb); good peak shapes and the predicted resolution from the model were obtained. Only standards were assessed in this work because the nature of API and drug matrices varies widely; for the actual analysis of nitrosamine impurities in drug samples, the impact of any potential matrix interferences would need to be assessed.
Figure 1: Pro EZGC Model Chromatogram for Nitrosamines Analysis
Figure 2: Lab-Generated Chromatogram for Nitrosamines Analysis
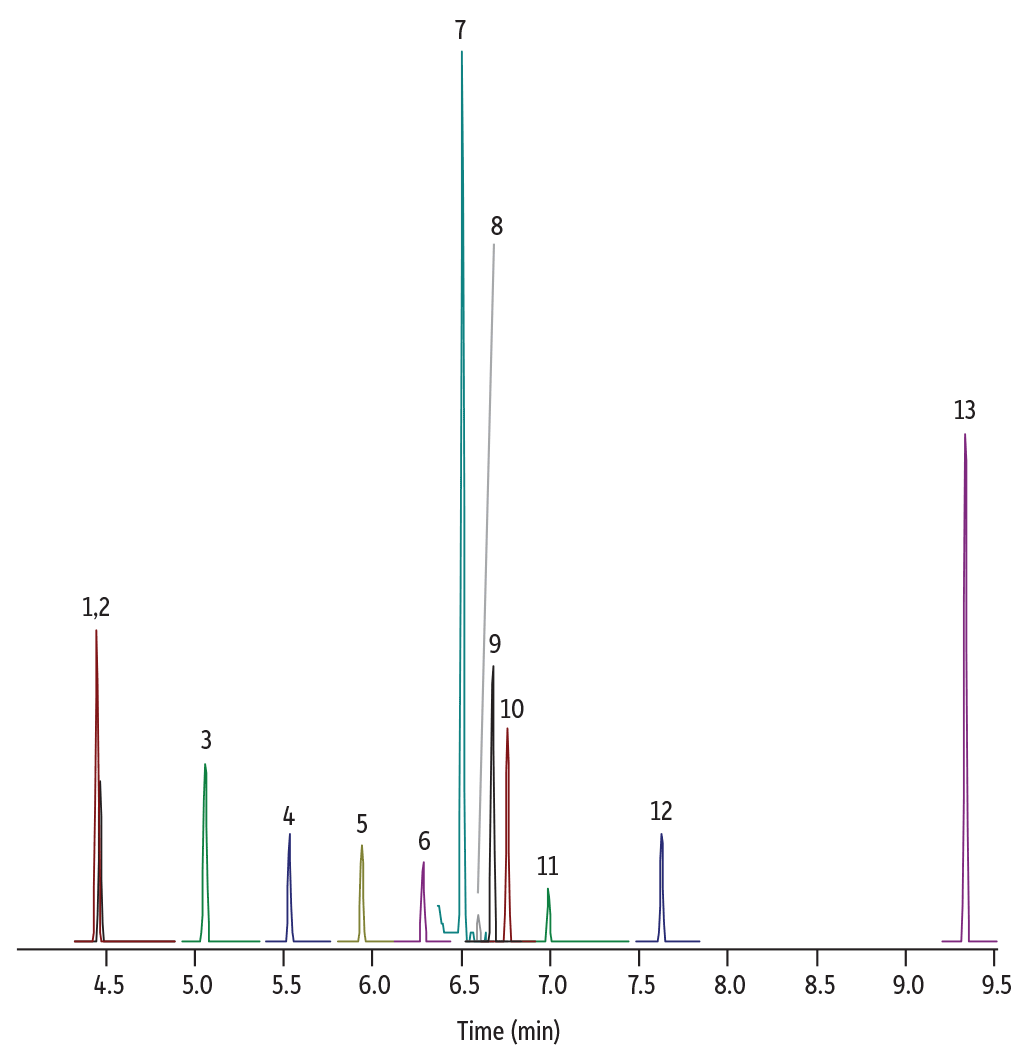
| Peaks | tR (min) | Conc. (µg/g) | Precursor Ion | Product Ion | Collision Energy | Confirmation Precursor Ion | Confirmation Product Ion | Collision Energy | |
|---|---|---|---|---|---|---|---|---|---|
| 1. | N-Nitrosodimethylamine (NDMA) | 4.48 | 120 | 74 | 42 | 18 | 74 | 43 | 12 |
| 2. | N-Nitrosodimethylamine-d6 (NDMA-d6) | 4.48 | 150 | 80 | 46 | 15 | 80 | 48 | 10 |
| 3. | N-Nitrosomethylethylamine (NMEA) | 5.08 | 120 | 88 | 42 | 16 | 88 | 43 | 8 |
| 4. | N-Nitrosodiethylamine (NDEA) | 5.56 | 120 | 102 | 44 | 12 | 102 | 56 | 14 |
| 5. | N-Nitrosoethylisopropylamine (NEIPA) | 5.96 | 120 | 116 | 44 | 12 | 116 | 99 | 6 |
| 6. | N-Nitroso-diisopropylamine (NDIPA) | 6.31 | 128 | 130 | 71 | 12 | 130 | 88 | 6 |
| 7. | Methylaniline (NMPA) | 6.53 | 131 | 107 | 77 | 26 | 106 | 77 | 14 |
| 8. | N-Nitroso-di-n-propylamine (NDPA) | 6.62 | 120 | 130 | 85 | 8 | 130 | 113 | 6 |
| 9. | N-Nitrosomorpholine (NMOR) | 6.71 | 120 | 116 | 56 | 10 | 116 | 86 | 6 |
| 10. | N-Nitrosopyrrolidine (NPYR) | 6.79 | 120 | 100 | 55 | 6 | 100 | 68 | 8 |
| 11. | N-Nitrosopiperidine (NPIP) | 7.02 | 120 | 114 | 69 | 6 | 114 | 84 | 8 |
| 12. | N-Nitrosodi-n-butylamine (NDBA) | 7.65 | 120 | 158 | 99 | 8 | 116 | 99 | 6 |
| 13. | Phenylbenzenamine (NDPHA) | 9.36 | 120 | 169 | 66 | 22 | 168 | 139 | 36 |
| Column | Rxi-624SilMS, 30 m, 0.25 mm ID, 1.4 µm (cat.# 13868) |
|---|---|
| Standard/Sample | Nitrosamine calibration mix, Method 521 (cat.# 31898) |
| N-Nitrosodimethylamine-d6 (cat.# 33910) | |
| N-Nitrosodiphenylamine (cat.# 31429) | |
| N-Nitroso-methylphenylamine | |
| N-Nitroso-diisopropylamine | |
| N-Nitrosoethylisopropylamine | |
| N-Nitrosomorpholine | |
| Diluent: | Methanol |
| Injection | |
| Inj. Vol.: | 1 µL split (split ratio 10:1) |
| Liner: | Topaz 4.0 mm ID straight inlet liner w/ wool (cat.# 23444) |
| Inj. Temp.: | 280 °C |
| Oven | |
| Oven Temp.: | 40 °C (hold 0.5 min) to 320 °C at 30 °C/min (hold 7 min) |
| Carrier Gas | He, constant flow |
| Flow Rate: | 1.2 mL/min |
| Detector | MS |
|---|---|
| Mode: | SIM |
| Transfer Line Temp.: | 280 °C |
| Analyzer Type: | Quadrupole |
| Source Temp.: | 325 °C |
| Instrument | Thermo Scientific TSQ 8000 Triple Quadrupole GC-MS |
| Notes | For N-nitroso-methylphenylamine (NMPA) and N-nitrosodiphenylamine (NDPHA), the nitroso groups are cleaved in the inlet to form methylaniline and phenylbenzeneamine, respectively. |
Calibration and Limits of Detection
Using linear regression, the target analytes showed acceptable linearity with r2 values of 0.996 and higher (Figure 3, Table III). For most of the compounds tested, the limits of detection were below 3 ppb, which is suitable for the analysis of nitrosamine impurities in drugs. NDELA and NMBA were notable exceptions; these compounds were not reportable due to low response. While both compounds can be analyzed by LC, NDELA is problematic with that approach too.
Figure 3: Calibration Curves
Table III: Calibration Parameters and Limits of Detection
|
Abbreviation |
Slope |
Intercept |
r2 |
LOD (ppb) |
|
NDMA |
1314 |
1015 |
0.9996 |
2.0 |
|
NMEA |
1682 |
18 |
0.9992 |
0.3 |
|
NDEA |
3257 |
-455 |
0.9997 |
1.2 |
|
NEIPA |
5820 |
-2919 |
0.9995 |
0.8 |
|
NDIPA |
2757 |
589 |
0.9998 |
0.3 |
|
Methylaniline |
12655 |
6901 |
0.9999 |
2.3 |
|
NDPA |
1778 |
5554 |
0.9967 |
0.7 |
|
NMOR |
2258 |
2364 |
0.9998 |
0.3 |
|
NPYR |
1672 |
822 |
0.9992 |
1.1 |
|
NPIP |
1826 |
385 |
0.9998 |
0.3 |
|
NDBA |
3384 |
300 |
0.9998 |
2.1 |
|
Phenylbenzenamine |
3912 |
3731 |
0.9981 |
2.7 |
Conclusion
Nitrosamine impurities in APIs or drug products present potentially negative health outcomes for patients, so new methods are needed to detect these emerging contaminants prior to batch release. In this work, an optimized method was developed using Pro EZGC chromatogram modeling software, which identified an Rxi-624Sil MS column and analytical conditions that produced optimal separations. Confirmation testing in the laboratory demonstrated that the method provided excellent resolution and fast run times of less than 10 minutes. Great linearity (R2>0.996) and LODs in the low ppb range (below 3 ppb) were established for all analytes, except NMBA and NDELA.
References
- S. Food and Drug Administration, Combined direct injection N-nitrosodimethylamine (NDMA), N-nitrosodiethylamine (NDEA), N-nitrosoethylisopropylamine (NEIPA), N-nitrosodiisopropylamine (NDIPA), and N-nitrosodibutylamine (NDBA) impurity assay by GC-MS/MS, 2019. https://www.fda.gov/media/123409/download