Optimizing GC-MS and GC-MS/MS Analysis of 3-MCPD and Glycidyl Esters in Edible Oils

Abstract
3-MCPD and glycidyl esters in edible oils are contaminants that are formed through refining processes and have been classified as possible human carcinogens. Methods have been developed by ISO, AOCS, and DGF for the analysis of 3-MCPD and glycidyl esters. While these methods cover extraction and derivatization techniques in detail, very little attention is paid to the GC-MS analysis method. With emerging automated systems streamlining the sample preparation workflow, it is important to simplify and speed up the analysis by optimizing method conditions and injection techniques.
Our initial optimization of the GC oven temperature program led to an 8-minute decrease in analysis time; however, additional time can be saved by utilizing free method development software (Pro EZGC chromatogram modeler). Current published methods recommend using either a split/splitless or a PTV inlet, with both operated in the splitless mode. We investigated split injection, and improved peak shapes were observed, which was not unexpected. However, the split injection technique also achieved similar limits of detection compared to a splitless injection, which was contrary to typical expectations for the two techniques.
Introduction
3-Monochloropropane diol (3-MCPD) esters are contaminants found in various refined oils and are formed from naturally occurring acylglycerols in the presence of chlorinated compounds during high-temperature deodorization processes [1]. The concentration varies in refined oils with the highest amount being found in palm and walnut oils. Animal studies show that the 3-MCPD esters are hydrolyzed in the gastrointestinal tract to free 3-MCPD, which is toxic. Kidneys and male reproductive organs are the main targets of toxicity in rats and mice [2].
Glycidyl esters are also contaminants in refined oils, but they are generated by a different process than the 3-MCPD esters [3]. The glycidyl esters are formed from diacylglycerols at high temperatures (>240 °C), and chlorinated compounds do not need to be present for the reaction to occur. Their fate after consumption is similar to 3-MCPD esters; i.e., they get hydrolyzed to glycidol in the gastrointestinal tract. Glycidol was shown to be genotoxic and carcinogenic during animal studies. The chemical structures of these compounds are shown in Figure 1.
Figure 1: Chemical structures of 3-MCPD, 3-MCPD esters, glycidol, and glycidyl esters.
As the food industry moves away from partially hydrogenated oils, trans fatty acids are less of a focal area. Now, the focus is on byproducts of oil refining. 3-MCPD and glycidyl ester (GE) are suspected carcinogens and while there are no U.S. Food and Drug Administration (FDA) limits, the European Food Safety Authority (EFSA) has established a tolerable daily intake of 2 µg/kg by body weight for 3-MCPD [4]. The European Union (EU) considers maximum limits for 3-MCPD esters to be 1.25 mg/kg for selected unrefined and refined oils, such as olive (excluding pomace oil), sunflower, soybean, and palm kernel oil, and 2.5 mg/kg for other refined vegetable oils and marine and fish oils [5].
Analysis of isomers of MCPD esters and glycidyl esters can be achieved by two approaches: direct and indirect. The direct method usually involves an LC-MS system, which provides full information about the sample composition without any chemical transformation of the MCPD or glycidyl esters. With no transesterification step, there should not be any transformation of MCPD esters into glycidyl esters and vice versa, although the high background of triacylglycerols will need to be removed to prevent these interferences from causing underestimation of the target compounds. Care must be taken during this step to ensure that the sample cleanup procedure does not also remove MCPD and glycidyl esters. Moreover, individual esters standards are needed for precise quantification, and their determination requires highly sensitive instrumentation, such as a high-resolution MS instrument.
The second approach is an indirect analysis. This methodology is more suited for routine analysis because it requires significantly fewer standards, and the sample preparation can be automated. These include the three AOCS methods (Cd 29a-13, Cd 29b-13, and Cd 29c-13) for analyzing MCPD and glycidyl esters in edible oils. All three methods follow a similar trajectory: transesterification to convert triacylglycerols into fatty acid methyl esters (FAMEs); neutralization of the alkaline conditions resulting from the transesterification; and extraction of the FAMEs as a cleanup step. Extraction of free MCPD and glycidol [transformed either to MCPD or brominated propanediol (MBPD) depending on the specific method chosen] is followed by derivatization with phenylboronic acid (PBA) to improve analyte volatility and make them more amenable to GC separation and MS or MS/MS analysis. While these methods cover sample handling in detail, very little attention is paid to the GC-MS analysis method. Emerging sample preparation automation systems are helping streamline the sample preparation. The analytical method can also be optimized to improve overall performance.
The AOCS methods, for instance, offer an opportunity to optimize the oven temperature program to speed up the analysis, and while that may not ultimately result in gains in sample throughput because even automated sample preparation processes may take longer than the analysis itself, it does provide an opportunity to either more thoroughly condition the column between analyses or even to simply permit cost-saving measures like gas flow reduction between analyses.
In addition to the oven temperature program, the injection technique was also explored with the goal of demonstrating whether or not split injections would produce acceptable results. Typically, methods call for the use of splitless injections by either a split/splitless inlet or a programmable temperature vaporization (PTV) inlet; however, by employing a split injection, especially for sample preparation methods that call for analyte derivatization, you can dramatically reduce the amount of the derivatization reagent that is transferred to the column and, as a consequence, potentially increase column lifetime.
We evaluated the use of two different inlets (PTV and split/splitless) as well as two modes of injection (split and splitless) at various temperatures. The method performance evaluation was based on instrumental limits of detection (LOD) and method sensitivity measured by the slope of the calibration curve.
Experimental
Chemicals and Materials
LC-MS grade solvents were purchased from Fisher Scientific. Diethyl ether; free 3-MCPD; sodium methoxide (25% in methanol); sodium hydroxide; sodium chloride; sodium bromide; sulfuric acid (25%); ortho-phosphoric acid (85%); and phenylboronic acid were purchased from Sigma Aldrich. Free 2-MCPD, 2-MCPD-d5, as well as glycidyl-d5 stearate, were purchased from Toronto Research Chemicals. Solutions of 3-MCPD depalmitate, 3-MCPD-d5 depalmitate, and glycidyl stearate were custom standards from Restek Corporation. Standards were stored at -20 °C. To provide a blank matrix, extra virgin olive oil (EVOO) was purchased at a local grocery store and was stored in the dark at room temperature.
Sample Preparation
Custom Restek standards were used as working solutions together with solutions prepared from neat materials. The calibration standards (either 3-MCPD esters or glycidyl ester) were prepared to cover a range of 0.002–12 mg/kg in oil.
Fortified EVOO samples were subsequently prepared for analysis by using modified versions of AOCS methods Cd 29b-13 and Cd 29c-13 (schema of method Cd 29c-13 is shown in Figure 2). The modifications to the published methods were mostly to reduce the amount of solvent used. The oil samples in both protocols were dissolved in methyl tert-butyl ether (replacing diethyl ether in method Cd 29b-13). During the second extraction step (Figure 2), the amount of diethyl ether/ethylene acetate was reduced to 500 µL per extraction (total 1.5 mL). Samples that were used for qualitative purposes were left in the diethyl ether/ethylene acetate solvent. For additional method details, please refer to the appropriate AOCS method.
Figure 2: Sample preparation procedure according to AOCS Cd 13c-29.
Pro EZGC Model
Restek’s online version of Pro EZGC chromatogram modeling software (www.restek.com/proezgc) is a selectivity tool that relies on a preloaded library of thermodynamic retention indices. The thermodynamic retention indices were generated for Rxi-17Sil MS columns. The following compounds were used to generate the indices: free 3-MCPD, 3-MCPD-d5, 2-MCPD, 2-MCPD-d5, glycidyl ester, and glycidyl-d5 ester. The free 3-MCPD, 3-MCPD-d5, 2-MCPD, and 2-MCPD-d5 were dissolved in ethyl acetate and derivatized with PBA prior to the analysis. The glycidyl ester and glycidyl-d5 ester were transformed to free 3-MBPD and 3-MBPD-d5, respectively, and then derivatized with PBA according to adjusted AOCS method Cd 29b-13. Samples for the Pro EZGC model were prepared in concentrations of 50-100 µg/mL.
Instrumentation
An Agilent 7890A GC coupled with a 5975C MSD was used for method optimization experiments and higher-concentration analyses. For trace-level analyses, a Thermo Fisher Scientific Trace 1310 GC coupled with a TSQ 8000 MS/MS was used. Data were processed using Agilent MSD Chemstation software (version F.01.03) and Thermo Scientific TraceFinder software (version 4.1 EFS). Testing was done using two Rxi-17Sil MS columns with dimensions of 30 m x 0.25 mm x 0.25 µm (cat.# 14123) and 20 m x 0.18 mm x 0.18 µm (cat.# 14102). The 20 m column was used in the Agilent instrument, and the 30 m column was used in both instruments. A Topaz 2.0 mm ID with single taper and glass wool liner was used for the Agilent instrument (cat.# 23316), and a Topaz 2.0 mm ID baffled liner for PTV was used for the Thermo instrument (cat.# 23438). Helium in constant flow mode was used in both instruments. Temperature programs for the inlets and column ovens are presented in Table I. Initial settings were taken from AOCS methods Cd 29b-13 and Cd 29c-13. The initial temperature for both PTV and GC programs was varied between 85 °C and 120 °C to determine the final programs.
Table I: Inlet and Oven Temperature Programs.
| Method Program | Final Program | |
| 20 m Column | none |
PTV: 120 °C to 165 °C at 300 °C/min (hold 10 min) to 320 °C at 300 °C/min (hold 8 min). GC: 120 °C (hold 0.5 min) to 200 °C at 18.5 °C/min to 330 °C at 35 °C/min (hold 5 min). |
| 30 m Column |
PTV: 85 °C to 165 °C at 300 °C/min (hold 10 min) to 320°C at 300 °C/min (hold 8 min). GC: 85 °C (hold 0.5 min) to 150 °C at 6 °C/min to 180 °C at 12 °C/min to 280 °C at 25 °C/min (hold 7 min). |
PTV: 120 °C to 165 °C at 300 °C/min (hold 10 min) to 320 °C at 300 °C/min (hold 8 min). GC: 120 °C (hold 0.5 min) to 180 °C at 12 °C/min to 330 °C at 25 °C/min (hold 5 min). |
Quantification was performed using the deuterated internal standard calibration method using the area of the target ions acquired in either SIM mode for single quad or SRM mode for triple quad. The monitored ions are shown in Table II. A least-square calibration curve was used to calculate the instrumental LODs using the formula LOD = 3.3*s y/k, where k is a slope of the calibration curve and s y is the standard error of the predicted y-value for each x-value; s y was obtained by a least-square linear regression.
Table II: GC-MS SIM ions and GC-MS/MS SRM transitions for all analytes.
| Compound | MS Monitored Ions (SIM) | MS/MS Monitored Ion Transitions | |||
| Ion 1 | Ion 2 | Precursor Ion (m/z) | Product Ion (m/z) | Collision Energy (V) | |
| 3-MCDP-d5 | 150 | 201 | 150 | 93 | 12 |
| 201 | 93 | 24 | |||
| 201 | 150 | 8 | |||
| 3-MCPD5 | 147 | 196 | 147 | 91 | 12 |
| 196 | 91 | 24 | |||
| 196 | 147 | 8 | |||
| 2-MCPD-d5 | 201 | 203 | 201 | 104 | 22 |
| 201 | 107 | 12 | |||
| 203 | 107 | 12 | |||
| 2-MCPD | 196 | 198 | 196 | 104 | 14 |
| 198 | 91 | 8 | |||
| 198 | 104 | 14 | |||
| 3-MBPD-d5 | 245 | 247 | NA - MBPD compounds are a product of sample prep in AOCS Method Cd 29b-13, which was not run on the MS/MS instrument. | ||
| 3-MBPD | 240 | 242 | |||
Results and Discussion
In cases where the instrument analysis time is longer than it takes to prepare a sample, reducing that analysis time might allow for higher throughput. Even when the sample preparation step is longer than the instrument analysis, however, it is still advantageous to look for ways to shorten the run time. The shorter analysis allows for longer column conditioning between runs and the potential for less carrier gas consumption through the use of gas-saver functions or method changes that reduce gas flow between analyses.
Both AOCS methods Cd 29b-13 and Cd 29c-13 follow the same GC temperature program and use PTV in splitless mode. The initial temperature for both the GC and PTV is 85 °C, but since solvent trapping is not required when the first analyte elutes at 13 minutes under the relatively slow oven ramp rate conditions, a higher inlet and oven temperature was explored to determine if the analysis time could be reduced with shorter inlet and oven temperature programs without sacrificing performance. Based on the solvent vapor calculation for the isooctane and 2 mm liner, the maximum splitless temperature is 120 °C. The tested sample was prepared by fortifying 3-MCPD depalmitate at 5 mg/kg level in EVOO. In order to find the best starting point, and knowing we wanted to explore higher temperatures and did not need to start at the initial published temperature of 85 °C, the inlet and oven temperatures were increased by increments of 5 °C from 95 °C to 120 °C. The analysis was conducted on the single quad MS, and peaks obtained in SIM mode were compared in terms of width and resolution. For comparison, we tested split as well as splitless injection.
Table III: 3-MCPD PBA derivative peak characteristics at different initial oven and PTV temperatures.
| Injection Technique | Initial Inlet & Oven Temperature (°C) | Retention Time of PBA Derivatives (min) | Peak Width of PBA Derivatives (min) | Resolution | ||
| 3-MCPD-d5 | 3-MCPD | 3-MCPD-d5 | 3-MCPD | |||
| Splitless | 95 | 8.03 | 8.07 | 0.03 | 0.035 | 0.762 |
| 100 | 7.62 | 7.66 | 0.022 | 0.034 | 0.864 | |
| 105 | 7.22 | 7.26 | 0.023 | 0.021 | 1.126 | |
| 110 | 6.82 | 6.86 | 0.023 | 0.022 | 1.075 | |
| 115 | 6.42 | 6.46 | 0.025 | 0.025 | 0.944 | |
| 120 | 6.04 | 6.07 | 0.027 | 0.027 | 0.830 | |
| Split | 95 | 8.03 | 8.07 | 0.02 | 0.028 | 1.033 |
| 100 | 7.62 | 7.66 | 0.02 | 0.019 | 1.241 | |
| 105 | 7.22 | 7.26 | 0.021 | 0.019 | 1.209 | |
| 110 | 6.82 | 6.86 | 0.019 | 0.019 | 1.273 | |
| 115 | 6.43 | 6.47 | 0.019 | 0.019 | 1.242 | |
| 120 | 6.04 | 6.00 | 0.019 | 0.018 | 1.244 | |
For the splitless injection, the peaks for both compounds were narrow across the 105-110 °C range while the peak widths were virtually unchanged at 100 °C and above in split mode (Table III). The split injection provides good peak shape and has the potential to reduce the amount of derivatization reagent on the column; however, there would naturally be concerns about achieving adequate sensitivity considering split is traditionally perceived as an injection technique for higher-concentration samples.
In order to evaluate the effect on sensitivity, we compared the limits of detection (LODs) acquired at an initial temperature of 110 °C and 120 °C for splitless and 120 °C for split injection. Figure 3 shows the comparison of calibration curves for both splitless and split injection (normalized to an internal standard response). The LODs were 0.14 mg/kg for splitless and 0.13 mg/kg for split injection. Neither slope nor LODs are affected by injection technique; i.e. split injection performs as well as splitless. Narrower peaks produced in split injections are taller, and so the added peak height makes up for the loss in peak area.
Figure 3: Comparison of calibration curves for both splitless and split injection of derivatized 3-MCPD normalized to internal standard response with derivatized 3-MCPD-d5.
Comparison between the PTV injector at 120 °C and 280 °C and the regular split injector at 280°C (Figure 4) also shows no effect on 3-MCPD responses; however, the use of a PTV injector can help with column lifetime because of the ability to further vent PBA after the analytes are transferred onto the column. Using a guard column (e.g., a 5 m x 0.25 mm Rxi guard [cat.# 10029] or a 10 m x 0.25 mm Rxi guard [cat.# 10059]) instead of a PTV injector is a viable alternative.
Figure 4: Comparison of calibration curves for split injection of derivatized 3-MCPD at different temperatures and inlets.
The limits of detection were well below the suggested limits for 3-MCPD and glycidyl esters (2 and 1 mg/kg, respectively). However, glycidyl esters are gaining more attention, especially when it comes to infant formula and baby food; therefore, a more sensitive method might be necessary. For this reason, we opted to use GC-MS/MS (Figure 5). With GC-MS/MS, the instrumental limit of detection dropped to 0.02 mg/kg. Alternatively, the lowest calibration sample (12 µg/kg) has a signal-to-noise ratio of 5:1 and could be used in lieu of an instrumental LOD.
Figure 5: Results of GC-MS/MS analysis of glycidyl stearate.
Using Software to Explore Further Method Optimization Opportunities
Restek’s online version of Pro EZGC software is a selectivity tool that relies on a preloaded library of thermodynamic retention indices. This makes it possible to predict retention times and optimize chromatographic methods without the need to analyze compound sets under many different conditions. Pro EZGC software selects the stationary phase by simultaneously adjusting film thickness, temperature, column length, column internal diameter, and flow. Users can enter each compound or copy/paste large lists of compounds into the program.
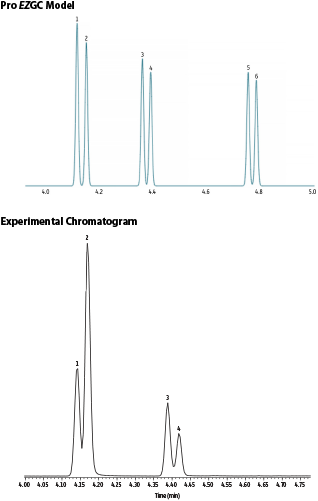
In order to further optimize the GC method, we chose to build and employ a new Pro EZGC library focusing on MCPD and glycidyl esters after hydrolysis and derivatization. The glycidyl esters can be analyzed either as 3-MCPD or as 3-MBPD, which are both in the model. Remember, if you try this yourself, be sure to change the column outlet to vacuum! The initial solution that the Pro EZGC tool provides uses one temperature ramp and predicts the elution of the last analyte (3-MBPD) in little over 5 minutes using a 20 m x 0.18 mm x 0.18 µm Rxi 17-Sil MS column. However, we wanted to keep the two-ramp temperature program, so we chose the starting point for our original method with a related tool—the EZGC method translator—and then refined it further using the Pro EZGC program. This yielded a new, faster GC temperature program capable of analyzing all analytes under five minutes (Figure 6).
Figure 6: Comparison of a Pro vGC model chromatogram and an actual chromatogram of fast MCPD analysis. Peaks: 1. 3-MCPD-d5 PBA derivative; 2. 3-MCPD PBA derivative; 3. 2-MCPD-d5 PBA derivative; 4. 2-MCPD PBA derivative; 5. 3-MBPD-d5 PBA derivative; and 6. 3-MBPD PBA derivative.
| Peaks | tR (min) | Conc. (ng/mL) | |
|---|---|---|---|
| 1. | 3-MCPD-d5 PBA derivative | 4.143 | 100 |
| 2. | 3-MCPD PBA derivative | 4.169 | 200 |
| 3. | 2-MCPD-d5 PBA derivative | 4.388 | 100 |
| 4. | 2-MCPD PBA derivative | 4.418 | 100 |
| Column | Rxi-17Sil MS, 20 m, 0.18 mm ID, 0.18 µm (cat.# 14102) |
|---|---|
| Standard/Sample | See notes |
| Diluent: | Isooctane |
| Injection | |
| Inj. Vol.: | 1 µL PTV split (split ratio 10:1) |
| Liner: | Topaz 2.0 mm ID straight inlet liner w/wool (cat.# 23314) |
| Inlet Temp. Program: | 120 °C to 165 °C at 300 °C/min (hold 10 min) to 320 °C at 300 °C/min (hold 8 min) |
| Oven | |
| Oven Temp.: | 120 °C (hold 0.5 min) to 200 °C at 18.5 °C/min to 330 °C at 35 °C/min |
| Carrier Gas | He, constant flow |
| Flow Rate: | 1 mL/min |
| Detector | MS | |
|---|---|---|
| Mode: | SIM | |
| SIM Program: | 147, 150, 196, 201 m/z, 50 ms dwell | |
| Transfer Line Temp.: | 320 °C | |
| Analyzer Type: | Quadrupole | |
| Source Type: | Inert | |
| Source Temp.: | 230 °C | |
| Quad Temp.: | 150 °C | |
| Ionization Mode: | EI | |
| Instrument | Agilent 7890A GC & 5975C MSD | |
| Sample Preparation | Standards were derivatized with 20 µL phenylboronic acid (saturated solution in diethyl ether), dried, and then reconstituted in 1 mL isooctane. Final concentrations are given in the peak table. | |
| Notes | Compounds and retention times in the peak list are from the actual chromatographic analysis. PBA derivatives of 3-MBPD-d5 and 3-MBPD were included in the Pro EZGC model, but not in the experimental analysis. | |
Conclusions
Here we explored optimization strategies and developed an improved, indirect GC-MS method for the analysis of 3-MCPD and glycidyl esters that produced better peak shapes without a detrimental effect on resolution. The empirically optimized temperature program saved 8 minutes per analysis while the method that was generated using Pro EZGC chromatogram modeling software can save up to 20 minutes. Using split injection instead of splitless had no negative effect on the limits of detection and offers the advantage of potentially extending column lifetime because less derivatization reagent enters the column. Opting for a regular split/splitless inlet instead of a PTV inlet also had no negative effect on performance; however, using a guard column is recommended. Finally, using GC-MS/MS led to a significant improvement to the limits of detection.
References
- World Health Organization, Joint FAO/WHO Expert Committee on Food Additives, November 2016. http://www.fao.org/3/a-bq821e.pdf
- A.P. Arisseto, W.C. Silva, R.G. Tivanello, K.A. Sampaio, E. Vicente, Recent advances in toxicity and analytical methods of monochloropropanediols and glycidyl fatty acid esters in food, Current Opinion in Food Science 24 (2018) 36-42. https://www.sciencedirect.com/science/article/abs/pii/S2214799318300675
- T.D. Haines, K.J. Adlaf, R.M. Pierceall, I. Lee, P. Venkitasubramanian, M.W. Collison, Direct determination of MCPD fatty acid esters and glycidyl fatty acid esters in vegetable oils by LC–TOFMS, J Am Oil Chem Soc 88(1) (2011) 1-14. https://www.ncbi.nlm.nih.gov/pmc/articles/PMC3022155/
- European Food Safety Authority, Revised safe intake for 3-MCPD in vegetable oils and food, 10 January 2018. https://www.efsa.europa.eu/en/press/news/180110
- EU considers maximum limits for 3-MCPD and 3-MPDEs in oils and fats, Oils & Fats International, 23 July 2019. https://www.ofimagazine.com/news/eu-considers-maximum-limits-for-3-mcpd-and-3-mpdes-in-oils-and-fats