C1-C10 PFAS Analysis in Human Plasma and Serum
Integrating Ultrashort-Chain Compounds into PFAS Biomonitoring

Abstract
Human exposure to ultrashort-chain (C1 to C3) PFAS and their potential adverse health effects are poorly understood, partly due to a lack of analytical methods to properly monitor their occurrence. This study introduces an innovative methodology for the simultaneous analysis of C1 to C10 carboxylic and sulfonic acid PFAS, along with four alternative compounds, in human plasma and serum samples. The chromatographic analysis was conducted using a polar-embedded, reversed-phase LC column for accurate and robust quantification.
Introduction
While concerns about the adverse effects of long-chain per- and polyfluoroalkyl substances (PFAS) on human health have led to increased biomonitoring, less is known about the potential toxicity of ultrashort-chain PFAS. Ultrashort-chain PFAS are ubiquitous in environmental aquatic systems and can occur at very high concentrations, so determining exposure levels is important, particularly for vulnerable populations. Since both human plasma and serum are widely used for biomonitoring longer-chain PFAS, developing methods that include shorter chain PFAS is critical to gaining a more comprehensive understanding of the relationship between PFAS exposure and adverse health outcomes.
Ultrashort-chain PFAS are small, highly polar compounds with carbon chain lengths shorter than C4 (Figure 1). Their high polarity creates a challenge for analytical practices that are based on reversed-phase liquid chromatography, primarily due to insufficient chromatographic retention. To improve analytical performance, the following method was developed on an Ultra IBD column because its polar-embedded stationary phase provides stronger retention of polar compounds, even in the presence of the various salts, electrolytes, and buffers that are inherently found in human plasma and serum.
In this study, a simple and reliable workflow was developed for the simultaneous analysis of C1 to C10 perfluoroalkyl carboxylic and sulfonic acids, along with four alternative PFAS, in human plasma and serum. The samples underwent a simple, single-step protein precipitation procedure and were analyzed with a user-friendly LC-MS/MS method. Method accuracy and precision were evaluated with fortified fetal bovine serum. In addition, the method’s suitability for real-world samples was confirmed by accurately measuring targeted PFAS with known concentrations in NIST standard reference human plasma (NIST SRM 1950) and serum (NIST SRM 1957).
Figure 1: Structures of C1 to C3 PFAS
Experimental
Plasma and Serum Samples
Since PFAS-free human plasma and serum were not found during the screening of commercially obtained samples, charcoal-stripped fetal bovine serum (FBS) obtained from MilliporeSigma (Burlington, MA) was used as the blank matrix for method verification because it did not contain any of the analytes of interest except for TFA. To compensate for this, a TFA isotope, 13C-TFA, was employed as a surrogate to assess method accuracy for TFA in FBS. NIST SRM 1950 (metabolites in human plasma) and NIST SRM 1957 (organic contaminants in non-fortified human serum) were purchased from NIST Store (Gaithersburg, MD). These SRMs are characterized by known concentrations of six or seven short-chain and long-chain PFAS.
Standard and Sample Preparation
TFA is commonly present in laboratory materials, such as pipette tips, glass and polypropylene HPLC vials, and polypropylene tubes. Following a comprehensive examination, the materials with the lowest TFA contamination levels were chosen for standard and sample preparation. Additionally, deionized water and reverse osmosis (RO) water generated at Restek were assessed to determine if they contained PFAS. The results revealed that RO water was free of PFAS contamination, with the exception of TFA, which was found to be present at very low levels. Consequently, RO water was used for the preparation of mobile phase and calibration standards.
The calibration standard solutions (100 µL) were prepared in RO water, supplemented with 1x phosphate-buffered saline (PBS), across a range of 0.05 to 40 ng/mL (ppb) in polypropylene HPLC vials. Initial testing revealed that early eluting compounds displayed slightly broader peak shapes in the human plasma and serum samples compared to the neat standard solutions prepared in 100% water. Therefore, PBS was incorporated into the standard solutions to mitigate this variability and ensure uniform chromatographic performance between standard and sample solutions.
Five isotopically labeled PFAS were used as quantitative internal standards (QIS) (Table I). A 5 µL aliquot of QIS working solution (40 ng/mL of 13C3-PFBA; 20 ng/mL of 13C2-PFHxA and 13C4-PFOA; and 10 ng/mL of 13C5-PFNA and 13C2-PFDA) was added to the standard solutions, which were then mixed with 200 µL of methanol containing 1.5% formic acid.
For the assessment of method accuracy and precision, 100 µL aliquots of FBS were fortified at 0.4, 2, 10, and 30 ppb with non-labeled PFAS and isotopically labeled 13C-TFA, which served as a surrogate for the determination of TFA recovery. The fortified FBS samples were mixed with 5 µL of QIS working solution and 2 µL of extracted internal standard (EIS) working solution (50 ng/mL of 13C3-PFPrA, 13C4-PFBA, 13C5-PFPeA, 13C5-PFHxA, 13C4-PFHpA, 13C8-PFOA, 13C9-PFNA, 13C6-PFDA, 13C3-PFHxS, and 13C8-PFOS). A 200 µL aliquot of methanol containing 1.5% formic acid was then added to the fortified FBS samples followed by vortexing for 30 seconds at 3000 rpm. After centrifugation at 4200 rpm for 10 minutes, approximately 150 µL of supernatant was transferred to a polypropylene vial insert (cat.# 24518), placed in a glass HPLC vial (cat.# 24626), and subsequently injected for LC-MS/MS analysis. This single-step protein precipitation in clean polypropylene HPLC vials was used to minimize background PFAS contamination and to ensure accurate measurement of target analytes. Non-fortified human plasma and serum samples were also prepared using the same procedure that was used for the fortified FBS samples.
Analytical System
PFAS analysis was performed by LC-MS/MS under the conditions shown below. A PFAS delay column was installed between the mixer and injector to prevent any potential PFAS contamination upstream of the injector from coeluting with PFAS in the samples.
System: Waters ACQUITY UPLC I-Class and Xevo TQ-S triple quadrupole mass spectrometer
Columns:
Injection volume: 5 µL
Mobile phase A: 5 mM ammonium formate, 0.1% formic acid in water
Mobile phase B: Acetonitrile
Flow rate: 0.3 mL/min
Temperature: 40 °C
Gradient:
| Time (min) | %B |
| 0.00 | 20 |
| 7.00 | 95 |
| 9.00 | 95 |
| 9.01 | 20 |
| 11.00 | 20 |
Ion mode: Negative ESI
Mode: Scheduled MRM
Results and Discussion
LC-MS/MS Method Development
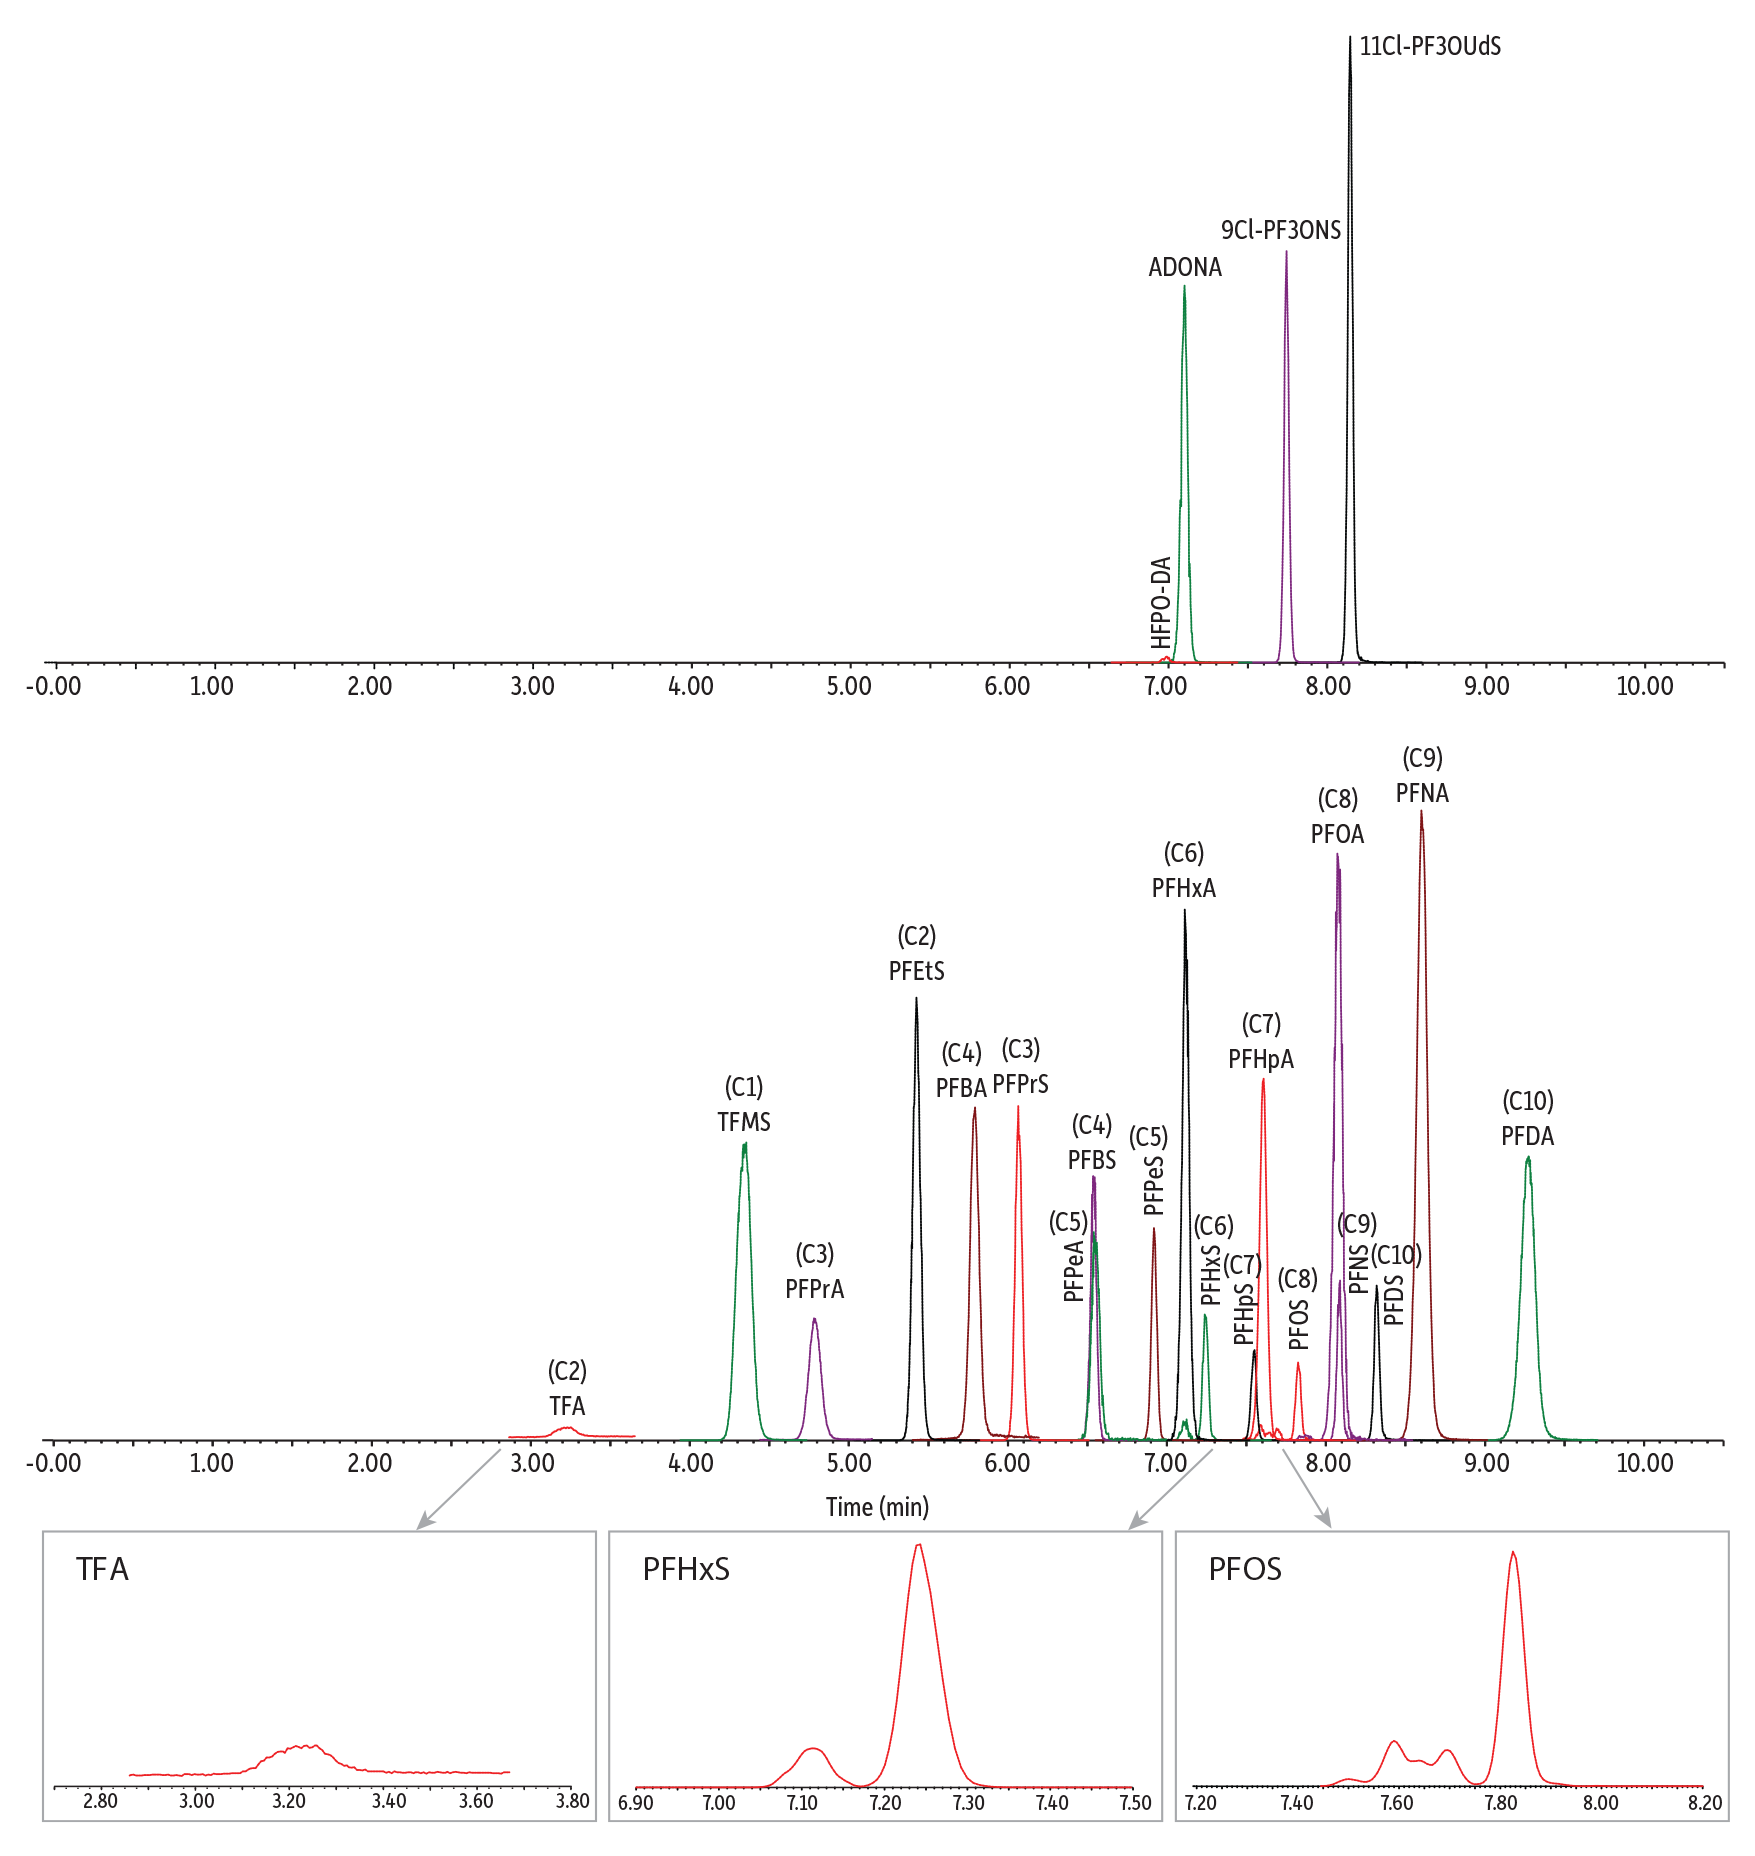
After exploring various mobile phases and chromatographic conditions, a final method (Figure 2) was established for the analysis of C1 to C10 PFAS in human plasma and serum. The polar embedded Ultra IBD column provided strong retention and good separation of early eluting, ultrashort-chain PFAS analyzed under reversed-phase conditions. More important, the extensive retention of ultrashort-chain PFAS, especially for the first-eluted analyte (TFA), led to reduced matrix interferences. Matrix impact was further minimized by using stable isotopes as internal standards to correct for any matrix interference during quantification. The MS/MS transition parameters and internal standards used for each analyte are provided in Table I.
Figure 2: Analysis of a 10 ppb PFAS Standard
| Column | Ultra IBD (cat.# 9175312) | ||||||||||||||||||||||||
|---|---|---|---|---|---|---|---|---|---|---|---|---|---|---|---|---|---|---|---|---|---|---|---|---|---|
| Dimensions: | 100 mm x 2.1 mm ID | ||||||||||||||||||||||||
| Particle Size: | 3 µm | ||||||||||||||||||||||||
| Pore Size: | 100 Å | ||||||||||||||||||||||||
| Temp.: | 40 °C | ||||||||||||||||||||||||
| Standard/Sample | PFAS 28 calibration standard (cat.# 30734) | ||||||||||||||||||||||||
| Diluent: | 1:2 water:methanol | ||||||||||||||||||||||||
| Conc.: | 10 ng/mL | ||||||||||||||||||||||||
| Inj. Vol.: | 5 µL | ||||||||||||||||||||||||
| Mobile Phase | |||||||||||||||||||||||||
| A: | Water, 5 mM ammonium formate, 0.1% formic acid | ||||||||||||||||||||||||
| B: | Acetonitrile | ||||||||||||||||||||||||
| |||||||||||||||||||||||||
| Max Pressure: | 275 bar |
| Detector | Waters Xevo TQ-S |
|---|---|
| Ion Mode: | ESI- |
| Mode: | MRM |
| Instrument | Waters ACQUITY UPLC I-Class |
| Sample Preparation | The standard solution (100 μL) was prepared in reverse osmosis water supplemented with 1x phosphate-buffered saline at 10 ng/mL (ppb) in a polypropylene HPLC vial followed by mixing with 200 μL of methanol containing 1.5% formic acid. |
| Notes | A PFAS delay column (cat.# 27854) was installed before the injector. The peaks of confirmation ions are not displayed in this chromatogram. |
Table I: MS Transitions and Analytes Retention Times
| Compounds | Retention Time (min) | Precursor Ion | Product Ions* | Cone (V) | Collision (V) | Quantification Internal Standard |
| Target Analytes | ||||||
| TFA | 3.25 | 113.03 [M-H]- | 69.01 | 10 | 10 | 13C3-PFBA |
| PFPrA | 4.81 | 162.97 [M-H]- | 119.02 | 10 | 8 | 13C3-PFBA |
| PFBA | 5.80 | 213.03 [M-H]- | 168.98 | 14 | 8 | 13C3-PFBA |
| PFPeA | 6.56 | 262.97 [M-H]- | 218.97 | 2 | 6 | 13C2-PFHxA |
| PFHxA | 7.13 | 313.10 [M-H]- | 268.97/118.99 | 2 | 8/20 | 13C2-PFHxA |
| PFHpA | 7.62 | 363.16 [M-H]- | 319.09/169.06 | 8 | 10/18 | 13C4-PFOA |
| PFOA | 8.10 | 413.10 [M-H]- | 368.96/168.90 | 2 | 10/16 | 13C4-PFOA |
| PFNA | 8.62 | 463.10 [M-H]- | 419.01/219.02 | 4 | 10/16 | 13C5-PFNA |
| PFDA | 9.29 | 513.17 [M-H]- | 469.16/219.06 | 4 | 12/16 | 13C2-PFDA |
| TFMS | 4.37 | 148.97 [M-H]- | 79.93/98.92 | 62 | 18/18 | 13C3-PFBA |
| PFEtS | 5.44 | 198.90 [M-H]- | 79.92/98.91 | 38 | 22/22 | 13C3-PFBA |
| PFPrS | 6.08 | 248.97 [M-H]- | 79.92/98.91 | 2 | 24/24 | 13C3-PFBA |
| PFBS | 6.55 | 298.97 [M-H]- | 79.97/98.89 | 2 | 26/26 | 13C2-PFHxA |
| PFPeS | 6.93 | 349.10 [M-H]- | 79.98/98.98 | 6 | 32/30 | 13C2-PFHxA |
| PFHxS | 7.24 | 398.90 [M-H]- | 79.97/98.89 | 56 | 32/34 | 13C2-PFHxA |
| PFHpS | 7.56 | 449.17 [M-H]- | 79.98/98.97 | 4 | 42/38 | 13C2-PFHxA |
| PFOS | 7.82 | 499.03 [M-H]- | 79.92/98.90 | 8 | 40/40 | 13C4-PFOA |
| PFNS | 8.09 | 549.10 [M-H]- | 79.92/98.83 | 12 | 42/40 | 13C4-PFOA |
| PFDS | 8.32 | 599.17 [M-H]- | 79.98/98.83 | 8 | 44/46 | 13C5-PFNA |
| HFPO-DA | 7.01 | 285.03 [M-COOH]- | 169.02/185.02 | 2 | 6/16 | 13C2-PFHxA |
| ADONA | 7.11 | 376.90 [M-H]- | 250.93/84.97 | 22 | 12/26 | 13C2-PFHxA |
| 9Cl-PF3ONS | 7.75 | 530.78 [M-H]- | 350.85/82.96 | 12 | 26/24 | 13C2-PFHxA |
| 11Cl-PF3OUdS | 8.15 | 630.78 [M-H]- | 450.80/82.95 | 8 | 26/32 | 13C5-PFNA |
| Extracted Internal Standards | ||||||
| 13C3-PFPrA | 4.81 | 165.97 [M-H]- | 120.96 | 10 | 11 | 13C3-PFBA |
| 13C4-PFBA | 5.80 | 217.03 [M-H]- | 171.98 | 2 | 8 | 13C3-PFBA |
| 13C5-PFPeA | 6.56 | 267.97 [M-H]- | 222.99 | 2 | 6 | 13C2-PFHxA |
| 13C5-PFHxA | 7.13 | 318.03 [M-H]- | 272.93 | 2 | 7 | 13C2-PFHxA |
| 13C4-PFHpA | 7.62 | 366.90 [M-H]- | 321.93 | 2 | 10 | 13C4-PFOA |
| 13C8-PFOA | 8.10 | 420.97 [M-H]- | 375.94 | 2 | 10 | 13C4-PFOA |
| 13C9-PFNA | 8.62 | 471.97 [M-H]- | 426.87 | 4 | 8 | 13C5-PFNA |
| 13C6-PFDA | 9.29 | 518.90 [M-H]- | 473.87 | 4 | 13 | 13C2-PFDA |
| 13C3-PFHxS | 7.24 | 401.90 [M-H]- | 79.97 | 2 | 32 | 13C2-PFHxA |
| 13C8-PFOS | 7.82 | 506.84 [M-H]- | 79.97 | 4 | 48 | 13C4-PFOA |
| Quantitative Internal Standards | ||||||
| 13C3-PFBA | 5.80 | 215.97 [M-H]- | 171.97 | 10 | 8 | |
| 13C2-PFHxA | 7.13 | 314.97 [M-H]- | 269.93 | 8 | 8 | |
| 13C4-PFOA | 8.10 | 416.87 [M-H]- | 371.88 | 2 | 8 | |
| 13C5-PFNA | 8.62 | 467.87 [M-H]- | 422.89 | 16 | 10 | |
| 13C2-PFDA | 9.29 | 514.87 [M-H]- | 469.84 | 8 | 10 | |
*Quantifier ion/qualifier ion. No qualifier ion was used for TFA, PFPrA, PFBA, and PFPeA because only one product ion could be identified for each.
Linearity
With quadratic regression (1/x weighted), all analytes showed acceptable linearities with r2 >0.995 and deviations <20%. Table II shows the specific linear range for each analyte, ranging from 0.05 ppb to 40 ppb, with variation occurring at the lowest calibration concentration.
Accuracy and Precision
Accuracy and precision for most analytes were assessed at 0.4, 2, and 10 ppb. However, for HFPO-DA and TFA, the evaluation was conducted at 2, 10, and 30 ppb because 0.4 ppb was below the linear range of these compounds. Three batches of samples were prepared and analyzed on different days, totaling nine replicates at each fortification level. The average recoveries and relative standard deviations (%RSD) are presented in Table II. All analytes exhibited recovery values within the range of 82.3–115% across the three fortification levels. Satisfactory method precision was demonstrated with %RSD values ranging from 0.965 to 11.3%. Additionally, the results indicated that all EIS had recovery values within 20% of the nominal concentration. The use of EIS as an additional quality control measure enhanced the reliability and robustness of the method.
Based on the results of the accuracy and precision experiments, the method LOQ was set as the lowest concentration of the standard calibration curve for each analyte. The method LOD was estimated from the analysis of fortified FBS and was defined by a peak signal-to-noise ratio of 3:1.
Measurement of C1–C10 and Alternative PFAS in NIST 1950 and 1957 SRMs
Six preparations of each SRM were analyzed with the developed LC-MS/MS method. The results indicated that all measured EIS concentrations fell within 20% of the nominal concentration. Moreover, Table III illustrates that the average experimental concentrations of most PFAS closely matched the reference concentrations, with deviations within 20%. Although the measured PFDA concentration in NIST SRM 1957 exhibited a slightly higher deviation of 26%, it remained within the deviation range of the reference concentration. These results demonstrated that the established method was suitable for accurate measurement of PFAS—including ultrashort-chain PFAS—in both human plasma and serum samples. In addition to the reference PFAS, other measurable PFAS were also reported in Table III.
Table II: Linearity, LOD, Accuracy, and Precision Results for Fortified Fetal Bovine Serum Samples
| Average Recovery (%RSD) | ||||||
| Linearity Range | LOD | Fortified Concentration (ng/mL) | ||||
| Analytes | (ng/mL) | (ng/mL) | 0.4 | 2 | 10 | 30 |
| 13C-TFA | 0.50 - 40 | 0.1250* | - | 90.6 (9.28) | 98.0 (2.99) | 100 (10.7) |
| PFPrA | 0.25 - 40 | 0.0102 | 108 (2.53) | 115 (0.965) | 105 (6.99) | - |
| PFBA | 0.10 - 40 | 0.0222 | 104 (5.57) | 109 (1.75) | 104 (1.51) | - |
| PFPeA | 0.10 - 40 | 0.0125 | 97.4 (3.25) | 93.3 (4.19) | 89.1 (5.57) | - |
| PFHxA | 0.10 - 40 | 0.0098 | 99.2 (2.46) | 109 (4.65) | 102 (6.31) | - |
| PFHpA | 0.10 - 40 | 0.0050 | 86.7 (5.37) | 99.2 (2.04) | 89.2 (1.80) | - |
| PFOA | 0.10 - 40 | 0.0051 | 94.8 (8.24) | 107 (5.30) | 95.6 (3.35) | - |
| PFNA | 0.10 - 40 | 0.0012 | 96.2 (1.44) | 111 (1.87) | 99.1 (2.62) | - |
| PFDA | 0.10 - 40 | 0.0083 | 93.6 (1.93) | 102 (2.03) | 95.5 (3.64) | - |
| TFMS | 0.05 - 40 | 0.0070 | 89.4 (7.33) | 88.8 (3.80) | 91.9 (3.19) | - |
| PFEtS | 0.05 - 40 | 0.0020 | 98.0 (2.62) | 103 (1.47) | 99.3 (2.26) | - |
| PFPrS | 0.05 - 40 | 0.0030 | 98.1 (8.18) | 108 (4.23) | 98.9 (4.15) | - |
| PFBS | 0.05 - 40 | 0.0124 | 88.0 (8.84) | 94.1 (4.95) | 86.5 (6.17) | - |
| PFPeS | 0.10 - 40 | 0.0031 | 94.8 (4.57) | 100 (8.05) | 94.3 (5.43) | - |
| PFHxS | 0.10 - 40 | 0.0115 | 85.8 (7.88) | 96.0 (10.0) | 92.2 (8.98) | - |
| PFHpS | 0.10 - 40 | 0.0088 | 92.5 (6.75) | 99.8 (6.45) | 93.4 (5.74) | - |
| PFOS | 0.10 - 40 | 0.0200 | 97.8 (8.66) | 97.9 (7.01) | 95.9 (3.37) | - |
| PFNS | 0.10 - 40 | 0.0129 | 92.1 (7.98) | 94.2 (4.43) | 91.9 (2.78) | - |
| PFDS | 0.10 - 40 | 0.0111 | 92.6 (8.20) | 82.3 (3.48) | 87.6 (3.55) | - |
| HFPO-DA | 0.50 - 40 | 0.1875 | - | 99.9 (11.3) | 91.1 (8.95) | 90.4 (6.13) |
| ADONA | 0.10 - 40 | 0.0035 | 90.4 (7.14) | 106 (4.67) | 95.7 (4.25) | - |
| 9Cl-PF3ONS | 0.10 - 40 | 0.0031 | 95.8 (4.20) | 93.7 (5.12) | 93.8 (6.71) | - |
| 11Cl-PF3OUdS | 0.10 - 40 | 0.0023 | 106 (5.10) | 84.5 (4.20) | 97.2 (4.86) | - |
*For non-labeled TFA
Table III: Quantification of PFAS in NIST 1950 and 1957 SRMs
| Analytes | Reference | Experimental Avg. | Experimental Precision (%RSD) | Relative Concentration (%)** |
| Conc. (ng/mL) | Conc. (ng/mL) | |||
| NIST SRM 1950 | ||||
| PFOA | 3.27 ± 0.06 | 3.12 | 3.70 | 95.4 |
| PFNA | 0.720 ± 0.028 | 0.85 | 0.74 | 117 |
| PFDA | 0.322 ± 0.007 | 0.30 | 3.47 | 91.6 |
| PFHxS | 3.25 ± 0.08 | 2.91 | 6.26 | 89.5 |
| PFOS | 10.64 ± 0.13 | 12.57 | 2.92 | 118 |
| TFA | - | 5.74 | 4.45 | - |
| PFPrA | - | 0.26 | 6.90 | - |
| PFHpA | - | 0.23 | 3.04 | - |
| TFMS | - | 0.08 | 3.95 | - |
| PFPeS | - | 0.15 | 4.31 | - |
| PFHpS | - | 0.36 | 4.90 | - |
| PFDS | - | 0.10 | 4.64 | - |
| NIST SRM 1957* | ||||
| PFHpA | 0.305 ± 0.051 | 0.28 | 2.16 | 92.1 |
| PFOA | 5.00 ± 0.44 | 4.21 | 1.91 | 84.2 |
| PFNA | 0.878 ± 0.077 | 0.77 | 1.38 | 87.9 |
| PFDA | 0.39 ± 0.12 | 0.29 | 2.69 | 74.4 |
| PFHxS | 4.00 ± 0.83 | 3.35 | 9.88 | 83.8 |
| PFOS | 21.1 ± 1.3 | 20.46 | 3.81 | 97.0 |
| TFA | - | 3.22 | 3.79 | - |
| TFMS | - | 0.07 | 0.10 | - |
| PFPeS | - | 0.10 | 7.97 | - |
| PFHpS | - | 0.48 | 6.20 | - |
| PFDS | - | 0.10 | 4.23 | - |
*The reference concentration for NIST SRM 1957 is presented as mass fraction (µg/kg).
**Relative concentration = (experimental concentration/reference concentration) x 100
Conclusions
A simple, reliable workflow was established in this study to incorporate ultrashort-chain PFAS analysis into a method that also included longer-chain PFAS that are commonly monitored in human plasma and serum. The method utilized a polar-embedded Ultra IBD column to increase chromatographic retention of these small polar analytes, and the results demonstrated that the method was rugged, accurate, and precise. Most important, this method can offer a valuable tool for gaining insights into human exposure to these emergent ultrashort-chain PFAS. Visit www.restek.com/PFAS for additional products, methods, and technical resources.